How to Collect Metrics from Multiple Sources with Fluent Bit
How to Collect Metrics from Multiple Sources with Fluent Bit
Applications and infrastructure are becoming increasingly complex with lots of components and modules. This complexity makes it difficult to track and monitor the different metrics generated by each component.
To complicate the matter, different systems may generate metrics, logs, and traces in different formats, making them difficult to track and monitor. Additionally, teams need to collect data from multiple sources and aggregate them to get a complete picture of the system.
To overcome these challenges, organizations need tools that enable them to collect and aggregate data from multiple sources, which can be used to provide insights to help identify issues and diagnose problems quickly.
Fluent Bit is one such open source tool that helps you collect and aggregate metrics, logs, and trace data from multiple sources. In this blog post, we’ll see how we collect application metrics and system metrics using Fluent Bit and push them to a visualization tool like Grafana.
About Fluent Bit
Fluent Bit is an open-source and lightweight telemetry agent designed to collect and ship logs, metrics, and traces from various sources to different destinations. It allows you to build custom data pipelines that filter, parse, and transform data before sending it to a destination
The major components of Fluent Bit are:
Input plugins: Collect data from various sources, including logs, metrics, and traces.
Parsers: Extract structured data from unstructured log data, making it easier to query and analyze.
Filters: Modify, route, or drop log data based on certain conditions, such as regex matching or metadata values.
Routers: Determine where data should be sent based on certain rules or conditions.
Buffers: Temporarily store log data before it is sent to its destination, helping to ensure that data is not lost if there is a network outage or destination failure.
Output plugins: Send log data to various destinations, such as Elasticsearch, Kafka, or cloud storage services.
Together, these components create a data pipeline that collects, processes, and routes telemetry data from different sources to its ultimate destination, whether that’s a centralized logging system, a monitoring dashboard, or an external analytics tool. Read more about data pipelines in Fluent Bit to learn more about it.
Collecting Metrics from Multiple Sources with Fluent Bit
Now we’ll see how we can use Fluent Bit to collect different metrics from different sources. To show this, we’ll configure Fluent Bit on our system to collect multiple metrics like System metrics (Data, CPU, Network, etc.) and custom Application metrics. We’ll then push these metrics to a Grafana Cloud dashboard.
We’ll collect these metrics and push them to the Grafana dashboard. We’ll be using Grafana Cloud for this, so please create a Grafana Cloud account if you don’t have one.
Fluent Bit Configuration
To get started with collecting metrics using Fluent Bit, we’ll configure it to run on our systems. While our’s is an Ubuntu-based system, you can refer to Fluent Bit’s installation documentation to set it up on yours.
Once the setup is ready, you need to change the INPUT and OUTPUT configurations as shown below:
[INPUT]
	name prometheus_scrape
	host 127.0.0.1
	port 5000
	tag k8s
	metrics_path /metrics
	scrape_interval 2s

[INPUT]
	name node_exporter_metrics
	tag node_metrics
	scrape_interval 2
Since we are collecting metrics, we are using node_metrics_exporter that provides CPU, disk, and network metrics. We are also using the prometheus_scrape to take metrics from our custom app.
You can refer to our earlier blog post on how to configure custom metrics on your applications.
[OUTPUT]
   	 Name prometheus_remote_write
   	 Host prometheus-us-central1.grafana.net
   	 Match *
   	 Uri /api/prom/push
   	 Port 443
   	 Tls on
   	 Tls.verify on
   	 Http_user abcf1234
   	 Http_passwd abcdefgh1234
For output, we’re using prometheus_remote_write which will basically send the scrapped metrics to a Grafana endpoint. The host is based on the zone where our Grafana cloud account is created.
Grafana Configuration
Deploying Grafana and setting it up is straightforward. Log in to your Grafana dashboard and navigate to the data sources section. From there, you can add a new data source and select Prometheus.
Provide the host details, which will depend on the zone where your account is located. In our case, it’s prometheus-us-central1.grafana.net Once you save these details, you can move on to creating a dashboard and adding visualizations.
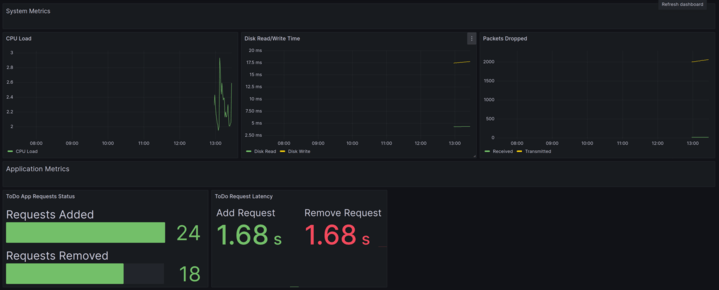
You can create a new dashboard from scratch, or use a pre-built dashboard we created. If you’ve configured everything correctly, you should start seeing metrics flowing in and displayed in the panels.
Summary
In conclusion, collecting metrics from multiple sources using Fluent Bit can greatly benefit organizations in their efforts to monitor and troubleshoot their applications and infrastructure. By utilizing Fluent Bit’s various components organizations can efficiently collect and route different types of data to their desired outputs.
If you are interested in trying out Fluent Bit for collecting metrics from multiple sources, there are various resources available online to help you get started.
Additionally, you may want to explore Calyptia Core, from the creators of Fluent Bit and Fluentd. Core simplifies the creation and management of data pipelines by providing a low-code UI for configuration, management, and monitoring. It also provides the ability to manage large-scale deployments of Fluent Bit as fleets. Request a personalized demo today to see how Calyptia Core could simplify and improve your observability and SIEM projects.
With the right tools and approach, collecting metrics from multiple sources can become a streamlined and efficient process, providing organizations with valuable insights into their systems and allowing them to proactively address any issues that may arise.
You might also like

A practical guide for avoiding data loss and backpressure problems with Fluent Bit
Learn how to detect and avoid backpressure problems with Fluent Bit by balancing memory-based and filesystem-based buffering.