
Convert Logs To Metrics in Legacy Applications Using Fluent Bit
Convert Logs To Metrics in Legacy Applications Using Fluent Bit
In software development, observability allows us to understand a system from the outside, by asking questions about the system without knowing its inner workings. Furthermore, it allows us to easily troubleshoot and helps answer the question, “Why is this happening?”
To be able to ask those questions to a system, the application must be instrumented. That is, the application code must emit signals such as traces, metrics, and logs.
Most modern applications are instrumented to output telemetry signals. However, at times you may find yourself working with systems that may not provide all the telemetry data you need. This is often the case when working with legacy applications, which may offer only a subset of the essential telemetry signals and whose codebase cannot be instrumented to provide more.
In such challenging situations, innovative solutions become imperative. You may have to derive telemetry data from other means.
This is where Fluent Bit comes into play. Fluent Bit is a widely used open-source data collection agent, processor, and forwarder that enables you to collect logs, metrics, and traces from various sources, filter and transform them, and then forward them to multiple destinations. It also addresses the aforementioned issues ingeniously.
In this blog , we will demonstrate how Fluent Bit can derive metrics from application logs, helping to bridge the gap between limited telemetry sources and comprehensive system observability.
Use Case: Getting Metrics from Legacy Applications
Consider a legacy application that logs HTTP requests and their corresponding status codes during processing. Here is an example log:
{
  "host": "31.163.219.152",
  "user-identifier": "-",
  "datetime": "31/Oct/2023:04:30:04 +0000",
  "method": "GET",
  "request": "/optimize/exploit/architect",
  "protocol": "HTTP/2.0",
  "status": 201,
  "bytes": 21985,
  "referer": "<http://www.leadschemas.biz/syndicate/seamless/experiences/repurpose>"
}
The challenge is to identify the HTTP Request Rate and Error Rate. However, instrumenting the application to generate metrics is not feasible, as it was developed using an outdated programming language version, and the existing instrumentation libraries do not support this older version.
However, the application log already contains status and request information. We can extract this data and convert it into metrics.
Prerequisites
Kubernetes Cluster: We will deploy Fluent Bit in a Kubernetes cluster. We will be using an EKS cluster, but any cluster will suffice.
Kubectl and Helm CLI: Installed on your local machine.
Familiarity with Fluent Bit concepts: Such as, inputs, outputs, parsers, and filters. If you’re not familiar with these concepts, please refer to the official documentation.
Deploying a Sample Legacy Application
Let’s deploy our legacy application into Kubernetes. For demonstration purposes, we’ll use a fake log generator.
Instructions:
1) Save the below deployment configuration in a file called application.yaml.
apiVersion: apps/v1
kind: Deployment
metadata:
  labels:
    app: legacy-application
  name: legacy-application
  namespace: default
spec:
  replicas: 1
  selector:
    matchLabels:
      app: legacy-application
  template:
    metadata:
      labels:
        app: legacy-application
    spec:
      containers:
        - image: mingrammer/flog:0.4.3
          name: legacy-application
          args: ["--loop", "--delay", "2", "--format", "json"]
2) Now, apply the configuration using the below command:
kubectl apply -f application.yaml3) View the Application Logs
kubectl logs deploy/legacy-application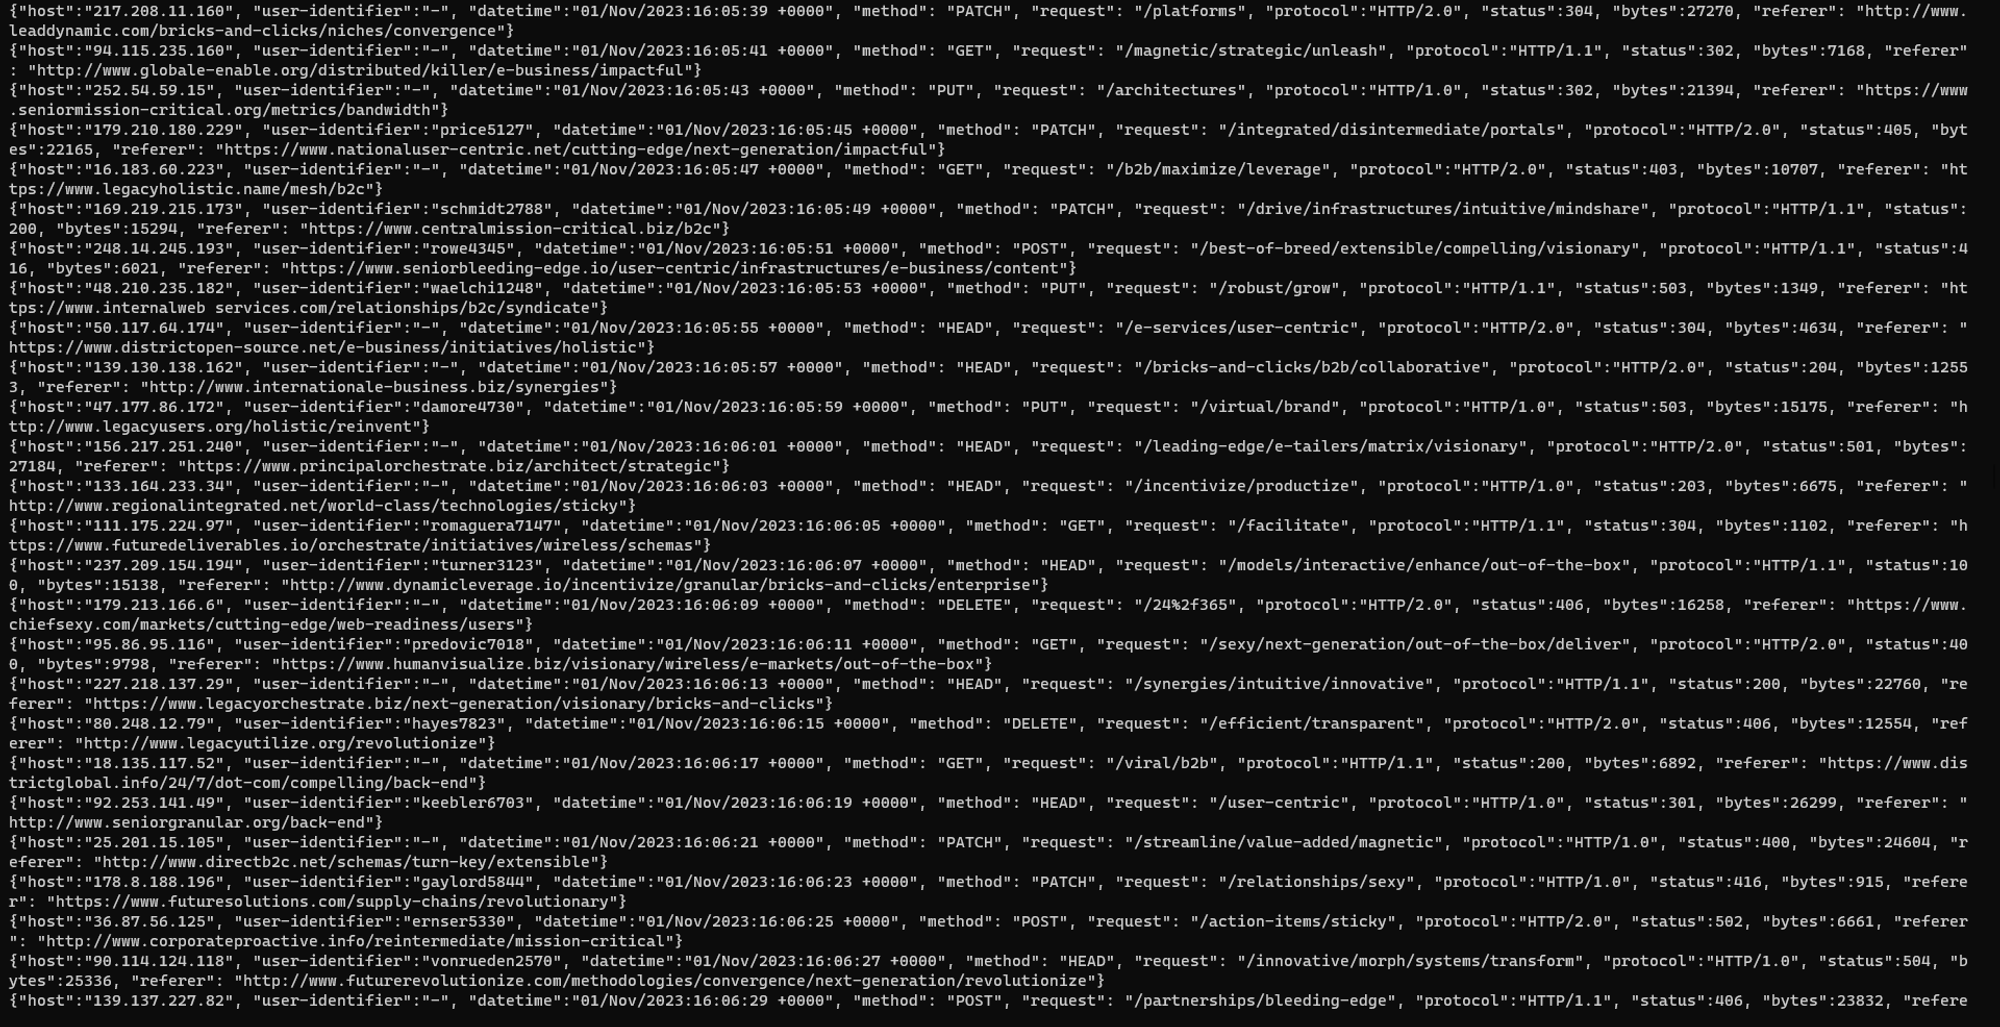
Converting Logs To Metrics
Metrics are stored in a Time Series Database such as Prometheus, InfluxDB, VictoriaMetrics etc. These databases require metrics to be stored in particular data types such as counter, gauge and histogram. Converting raw logs into structured metrics involves a systematic approach, the below rules give a brief outline.
Rules for Converting Logs to Metrics
List the Required Metrics:
As discussed above, We want two metrics HTTP request rate and HTTP error rate.
Identify Corresponding Log Values:
From application logs, the request field contains the endpoint path for HTTP requests which can be mapped to the HTTP request rate metric while the status field indicates the HTTP status code. It ranges from 200 to 599. We are particularly interested in monitoring status codes greater than 500, indicating server errors that can be mapped to the HTTP error rate.
Determine the Metric Type:
HTTP Request Rate (e.g., Requests Per Second):
Appropriate Metric Type: Counter
Explanation: Counters are ideal for measuring rates, such as the total number of HTTP requests served. To calculate the request rate, take the derivative of the counter value over time. This yields metrics like requests per second (RPS) or requests per minute (RPM), based on our preference.
Error Rate (Based on HTTP Status Codes):
Appropriate Metric Type: Counter or Gauge
Explanation: For error rates derived from HTTP status codes, counters are commonly used. You can create counters like
http_errors_total{status="4xx"}to tally 4xx client errors orhttp_errors_total{status="5xx"}for 5xx server errors. Counters are suitable because they steadily increase, providing a cumulative count of errors over time.
With the prerequisites for metrics now elucidated, let’s implement it in practice.
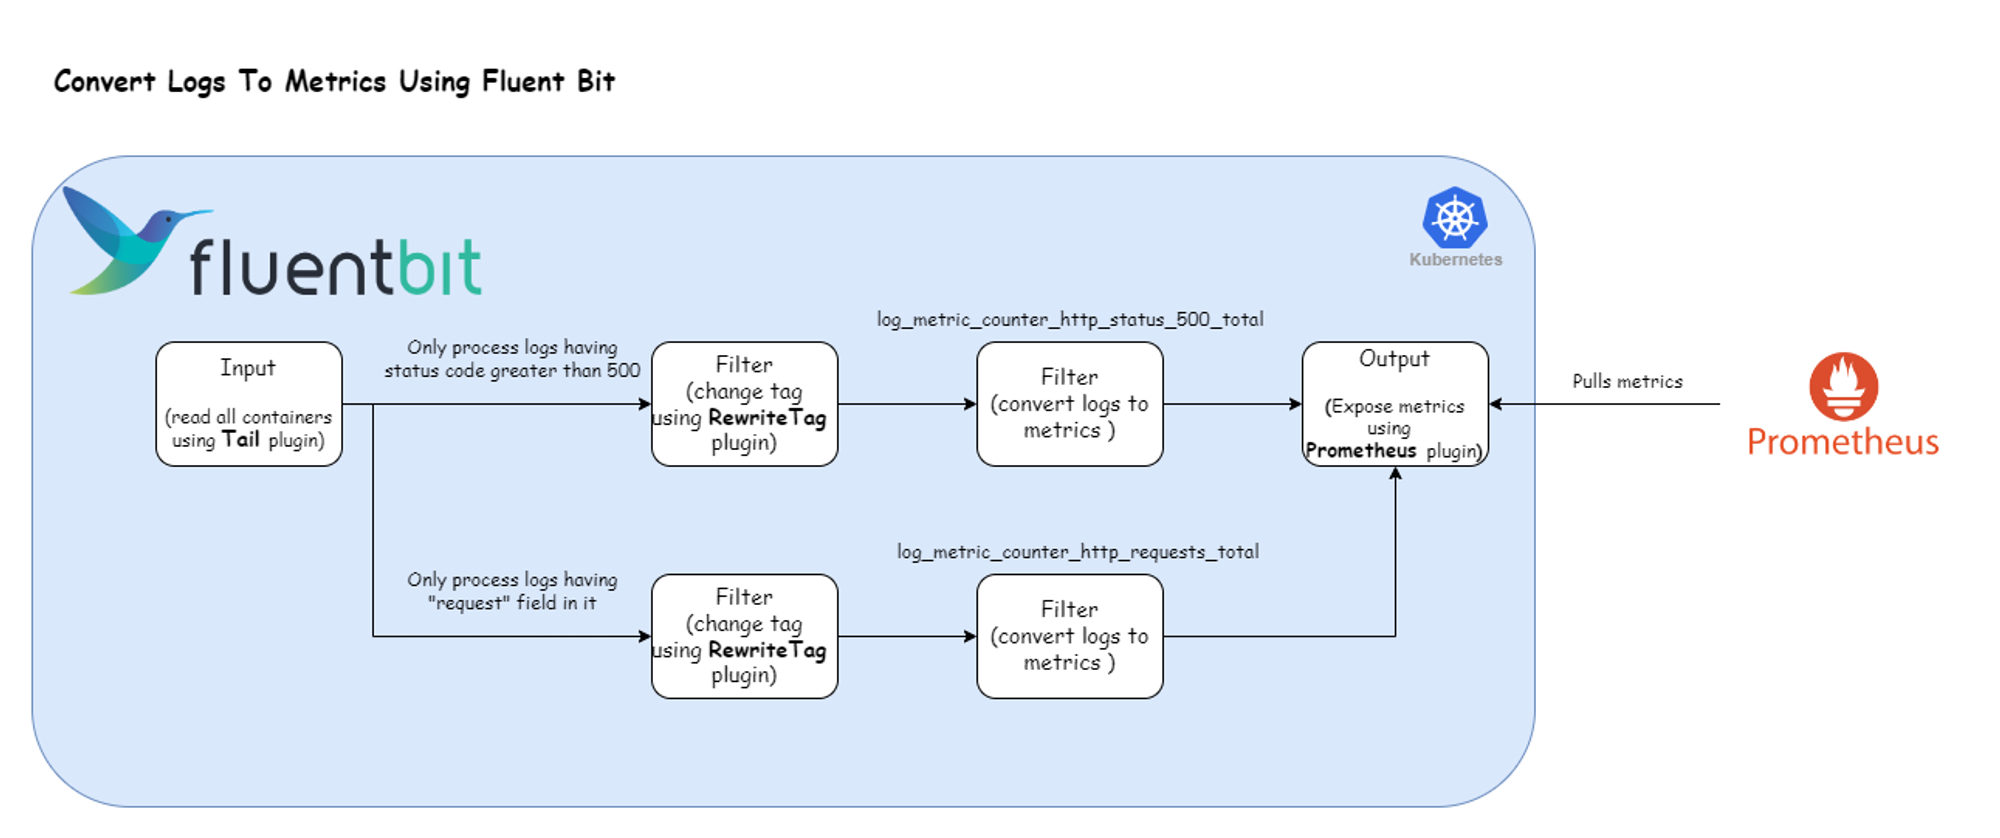
Here’s the Fluent Bit configuration that enables the log processing pipeline depicted above:
config:
  customParsers: |
    [PARSER]
        Name         crijsonparser
        Format       regex
        Regex        ^(?<time>[^ ]+) (?<stream>stdout|stderr) (?<logtag>[^ ]*) (?<log>.*)$
        Decode_Field json log

  inputs: |
    [INPUT]
        Name  tail
        Tag   kube.*
        Path  /var/log/containers/*default_legacy-application*
        Parser crijsonparser

  filters: |
    [FILTER]
        Name          rewrite_tag
        Match         kube.*
        Rule          log \"request\"\s*:\s*"\s*\/[^"]+"  http_requests_total true
    [FILTER]
        name               log_to_metrics
        match              http_requests_total
        tag                metrics
        metric_mode        counter
        metric_name        http_requests_total
        metric_description This metric counts http requests
    [FILTER]
        Name          rewrite_tag
        Match         kube.*
        Rule          log \"status\"\s*:\s*5\d{2} http_status_500_total true
    [FILTER]
        name               log_to_metrics
        match              http_status_500_total
        tag                metrics
        metric_mode        counter
        metric_name        http_status_500_total
        metric_description This metric counts http request with 500 status code in response

  outputs: |
    [OUTPUT]
        name  prometheus_exporter
        match metrics
        host  0.0.0.0
        port  2021
Breaking down the configuration above, we define one input section:
This input section exclusively targets Legacy Application container logs running in the default namespace, marked with the tag kube.*.
The filter section comprises four filters:
1) Rewrite Tag Filter: This section selects all the logs that match the tag kube.* and applies the regex \"request\"\s*:\s*"\s*\/[^"]+". For logs that satisfy the regex expression we apply the tag http_requests_total. The configuration value of the Rule field is mapped to the format $KEY REGEX NEW_TAG KEEP.
$KEY: The key represents the name of the record key that holds the value that we want to use to match our regular expression. In our case, it is
logas the record generated by tail plugin stores the log message under the key namedlog.Regex: Using a simple regular expression, we specify a matching pattern to apply to the value of the key specified above. Here is the breakdown of the regex that we used:
"request"matches the literal string "request".\s*:\s*matches the colon (:) with optional spaces before and after."\s*/[^"]+"matches a double quote (") followed by a slash (/) and then one or more characters that are not double quotes, ending with a double quote.
New Tag: If our regular expression matches the value of the defined key in the rule, we apply a new Tag for that specific record:
http_requests_total.Keep: If a rule matches, the filter emits a copy of the record with the newly defined Tag. The
keepproperty takes a boolean value to determine whether the original record with the old Tag should be preserved and continue in the pipeline or be discarded. In our case, we will be setting it to true because we might want to send the original records (logs) to some other destination.
For more information about this plugin, check the official documentation.
2) Log To Metrics Filter: This plugin allows you to generate log-derived metrics. It currently supports modes to count records, provide a gauge for field values, or create a histogram. As noted above, we have configured this filter to catch records with the tag http_requests_total and convert it into a counter metric. After conversion, the generated metric gets a new tag called metrics.
Note: the Fluent Bit Logs to Metric filter includes a Regex configuration parameter which can be used to match which logs should be converted to metrics. However, it fails to match when the value is numeric (http status code) rather than text. Hence the need for the Rewrite Tag Filter. Another option would be to use the Fluent Bit Lua filter to write a custom script that would convert the numerical value to a text string. You can track the issue status on GitHub.
These same set of two filters are also used to operate on logs that satisfy the regex \"status\"\s*:\s*5\d{2}, which captures logs having a status code greater than 500 for calculating HTTP Error Rate. Here is the breakdown of regex:
"status": Matches the literal string "status".\s*: Matches zero or more whitespace characters.:: Matches the colon character.\s*: Matches zero or more whitespace characters.5\d{2}: Matches a number starting with5followed by exactly 2 digits (\drepresents any digit).
For more information about this plugin, check the official documentation.
Further down the pipeline, the output section consists of one output:
Prometheus: This section matches all the records which has tag metrics and exposes it for Prometheus to consume on port 2021 of Fluent Bit container. For more information about this plugin, check the official documentation.
Deploy our Fluent Bit Configuration
Let’s deploy the above Fluent Bit configuration using the Helm chart available at Fluent Bit Helm Chart.
1) Add Fluent Bit Helm Repo
Use the command below to add the Fluent Bit Helm repository:
helm repo add fluent <https://fluent.github.io/helm-charts>2) Override default configuration
Create a file called values.yaml with the following contents:
config:
  customParsers: |
    [PARSER]
        Name         crijsonparser
        Format       regex
        Regex        ^(?<time>[^ ]+) (?<stream>stdout|stderr) (?<logtag>[^ ]*) (?<log>.*)$
        Decode_Field json log

  inputs: |
    [INPUT]
        Name  tail
        Tag   kube.*
        Path  /var/log/containers/*default_legacy-application*
        Parser crijsonparser

  filters: |
    [FILTER]
        Name          rewrite_tag
        Match        kube.*
        Rule          log \"request\"\s*:\s*"\s*\/[^"]+"  http_requests_total true
    [FILTER]
        name               log_to_metrics
        match             http_requests_total
        tag                   metrics
        metric_mode        counter
        metric_name        http_requests_total
        metric_description  This metric counts http requests
    [FILTER]
        Name          rewrite_tag
        Match        kube.*
        Rule          log \"status\"\s*:\s*5\d{2} http_status_500_total true
    [FILTER]
        name               log_to_metrics
        match             http_status_500_total
        tag                   metrics
        metric_mode        counter
        metric_name        http_status_500_total
        metric_description This metric counts http request with 500 status code in response

  outputs: |
    [OUTPUT]
        name  prometheus_exporter
        match metrics
        host  0.0.0.0
        port  2021
3) Deploy Fluent Bit
Use the command below:
helm upgrade -i fluent-bit fluent/fluent-bit --values values.yaml4) Wait for Fluent Bit pods to run
Ensure that the Fluent Bit pods reach the Running state.
kubectl get podsDeploy Prometheus and Visual Our Metrics
Create a file called prometheus.yaml with the following contents:
apiVersion: apps/v1
kind: Deployment
metadata:
  name: prometheus
spec:
  replicas: 1
  selector:
    matchLabels:
      app: prometheus
  template:
    metadata:
      labels:
        app: prometheus
    spec:
      containers:
      - name: prometheus
        image: prom/prometheus:v2.47.2
        ports:
        - containerPort: 9090
        args:
        - "--config.file=/etc/prometheus/prometheus.yml"
        volumeMounts:
        - name: config-volume
          mountPath: /etc/prometheus
      volumes:
      - name: config-volume
        configMap:
          name: prometheus-config
---
apiVersion: v1
kind: ConfigMap
metadata:
  name: prometheus-config
data:
  prometheus.yml: |
    global:
      scrape_interval: 5s

    scrape_configs:
      - job_name: 'legacy-application'
        static_configs:
          - targets: ['fluent-bit.default.svc.cluster.local:2021']
---
apiVersion: v1
kind: Service
metadata:
  name: prometheus-service
spec:
  selector:
    app: prometheus
  ports:
    - protocol: TCP
      port: 9090
      targetPort: 9090
  type: ClusterIP
Apply it using kubectl apply -f prometheus.yaml
Visualizing Our Metrics Derived from Logs
Open the Prometheus console locally using the command below:
kubectl port-forward service/prometheus-service 9090:9090To see the http request rate metric, execute the following PromQL query:
rate(log_metric_counter_http_requests_total[1m])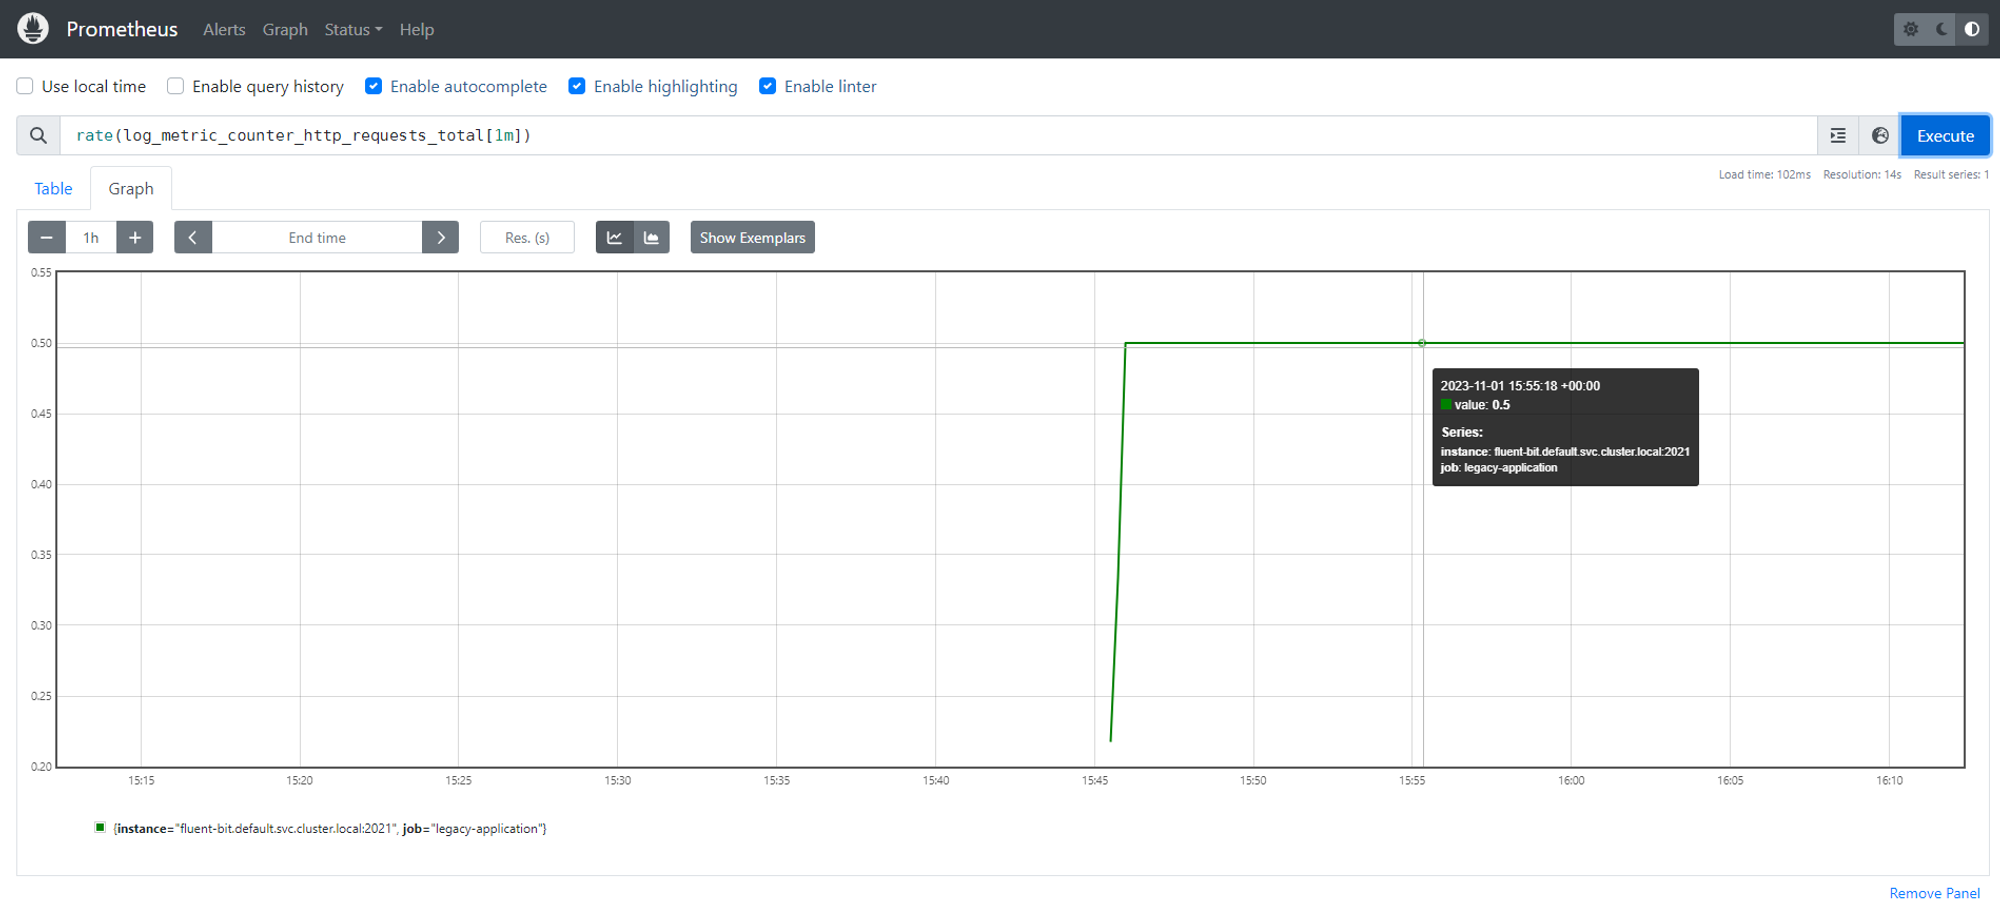
To obtain the http error rate, execute the below PromQL query:
rate(log_metric_counter_http_status_500_total [1m]) / rate(log_metric_counter_http_requests_total [1m])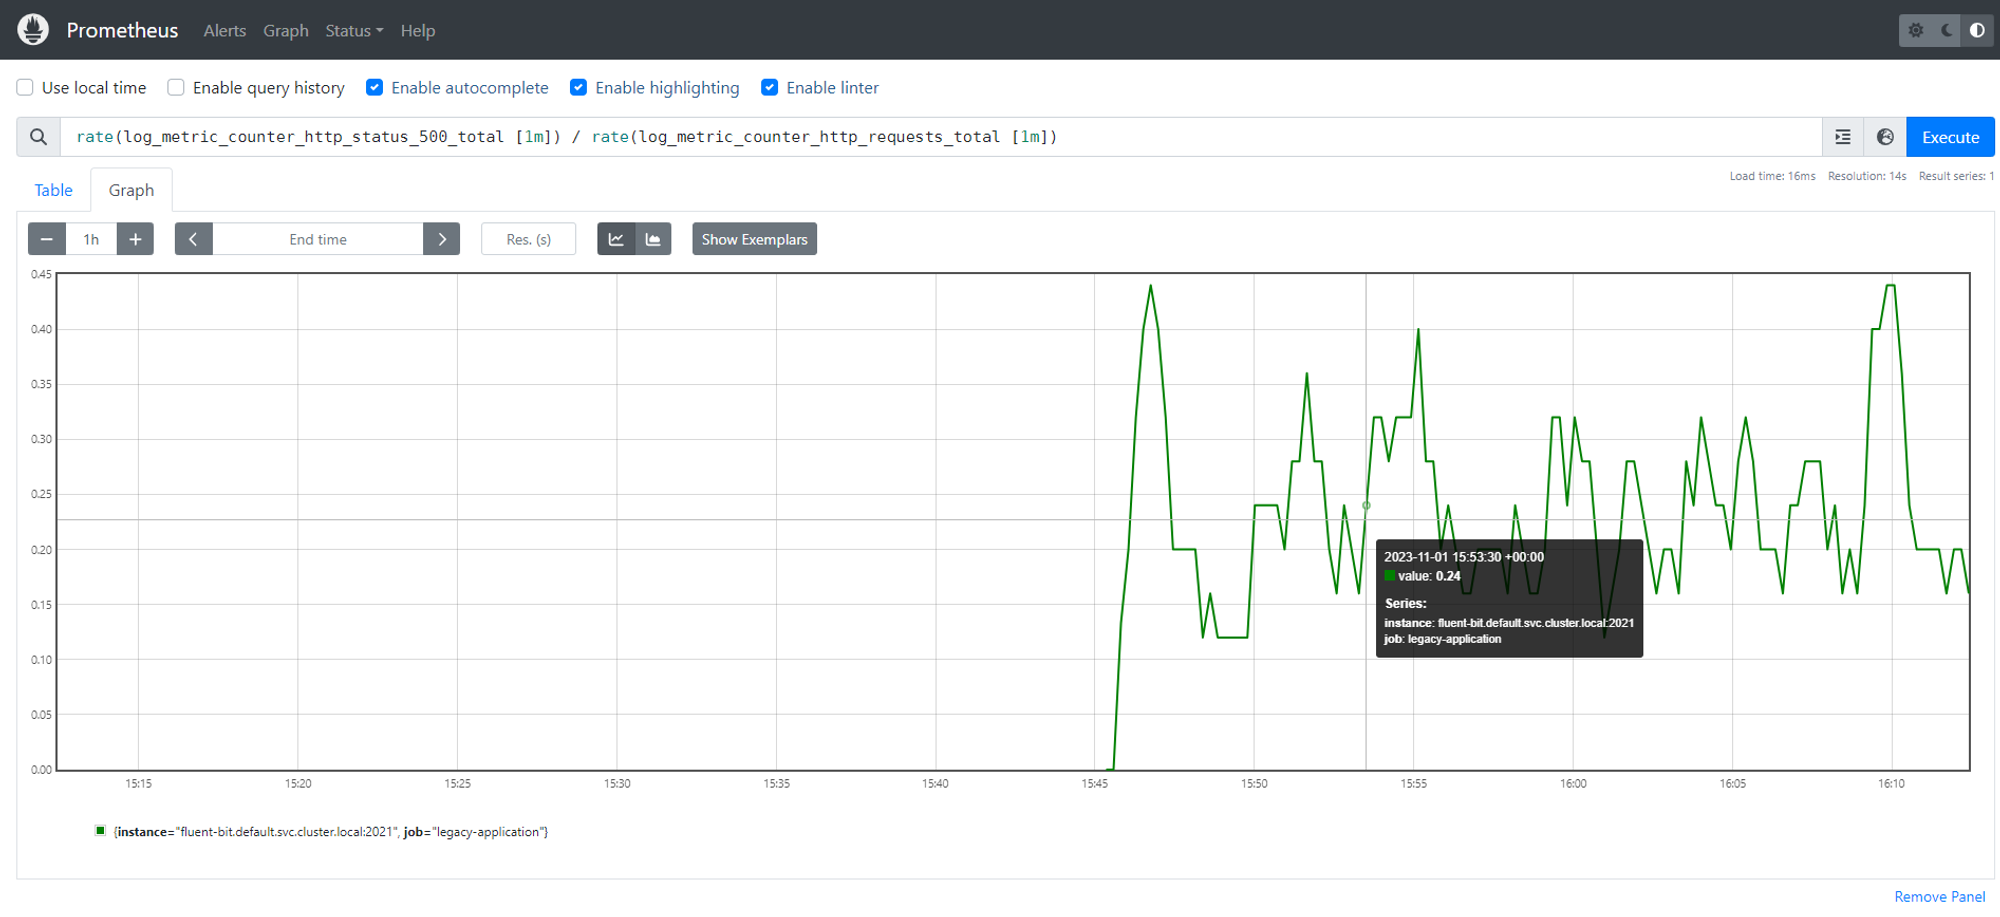
Conclusion
Fluent Bit is one of the most widely adopted logging and metrics processors and forwarders. It is deployed by default in major Kubernetes distributions, including Google Kubernetes Engine (GKE), AWS Elastic Kubernetes Service (EKS), and Azure Kubernetes Service (AKS), and is being used by top technology companies Meta, Cisco, LinkedIn, and many more.
The Logs to Metrics filter enables Fluent Bit to solve more challenges for organizations, especially for organizations looking to bring observability to legacy applications.
Learn more about data processing with Fluent Bit

Converting logs to metrics is just one of the ways that Fluent Bit enables users to process in-flight data as it flows through the pipeline before arriving at its destination. Fluent Bit can also redact or enrich your data and analyze it to determine where it should be routed based upon your business rules. There are dozens of native plugins available that allow you to process and transform your data in flight. To learn more, check out our free, on-demand webinar “Advanced Processing with Fluent Bit.”

Or download a free preview copy of Fluent Bit with Kubernetes by Phil Wilkins, compliments of Calyptia, the creators of Fluent Bit.
You might also like

Fluent Bit and Fluentd – a child or a successor?
Fluent Bit may have started as a sibling to Fluentd, but it is fair to say that it has now grown up and is Fluentd's equal. Learn which is right for your needs and how they can be used together.