Enforcing structured logging across applications using Fluent Bit
Enforcing structured logging across applications using Fluent Bit
Application logs are an important part of the software development process. However, traditional log formats like plain text, key-value pairs can be difficult to parse and analyze, especially at scale. This is where structured logging comes in.
Structured logging is a way of formatting log messages as structured data, such as JSON or XML. It has several advantages over traditional log formats:
Structured logs are easier to read and understand, especially for developers unfamiliar with the codebase.
Structured logs are easier to search and filter for specific events or errors.
Structured logs are easily parsed and analyzed by observability tools, making it easier to identify trends and troubleshoot issues.
Structured logs help in future proofing, by preventing future breakage when developers add new things or change existing stuff.
By enforcing structured logging in applications, you can gain insights about how applications are performing, identify potential issues, and improve overall reliability of your system.
However, implementing structured logging across applications isn't without its challenges. You may encounter issues like external libraries using the plain text format, applications using more than one format or find developers overriding the default configurations. Moreover, if an application's log format differs from the expected structured format, it can disrupt the log destination.
Enter Fluent Bit, a widely-used open-source data collection agent, processor, and forwarder that enables you to collect logs, metrics, and traces from various sources, filter and transform them, and then forward them to multiple destinations.
In this article, we will leverage Fluent Bit’s log processing capabilities to ensure consistent structured logging across applications using two different methods. In addition, we demonstrate how to send alerts to Slack when the logs are not properly formatted.
Prerequisites
Kubernetes Cluster: We will deploy Fluent Bit in a Kubernetes cluster and ship logs of application containers inside Kubernetes. We will be using an EKS cluster, but any cluster will suffice.
Slack Channel: We will use Slack as the destination for sending our alerts.
Kubectl and Helm CLI: Installed on your local machine.
Elasticsearch Cluster: We will use Elasticsearch as the destination for sending our logs. See our previous blog post for assistance with configuring Fluent Bit and Elasticsearch.
Familiarity with Fluent Bit concepts: Such as, inputs, outputs, parsers, and filters. If you’re unfamiliar with these concepts, please refer to the official documentation.
Getting Up To Speed
Let’s start by establishing an initial configuration that mirrors the scenario where the applications are using both structured and unstructured logging practices.
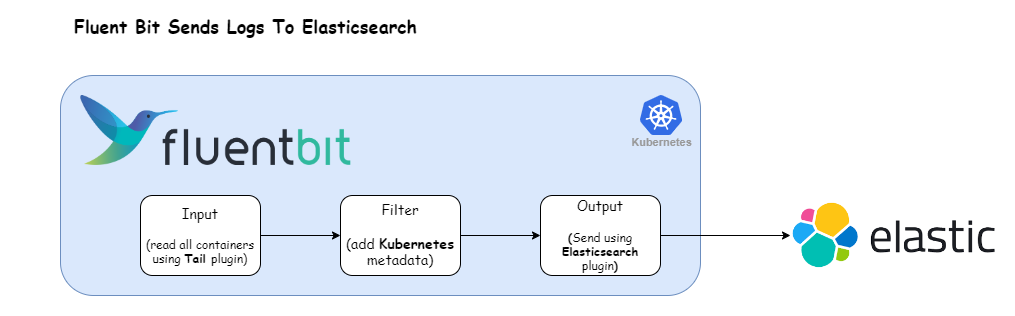
We’ll work with the following Fluent Bit configuration:
[INPUT]
        Name  tail
        Tag   kube.*
        Path  /var/log/containers/*.log

[FILTER]
        Name   kubernetes
        Match  kube.*

[OUTPUT]
        Name   es
        Match  *
        Host  <your-elastic-host-address>
        Port  443
In this setup, the Tail plugin is utilized to ingest container logs, which are then directed to an Elasticsearch cluster using the es plugin.
Let’s deploy the above Fluent Bit configuration using the Helm chart available at Fluent Bit Helm Chart.
Instructions:
1) Deploy Log Generator Application
In our Kubernetes cluster, we will deploy two applications called structured and unstructured logger that generate random logs (imitating HTTP requests). The rate and format of the logs are configurable; check this documentation for more information. Create a file called apps.yaml with the following contents and apply it using kubectl apply -f apps.yaml command.
apiVersion: apps/v1
kind: Deployment
metadata:
  labels:
    app: unstructured-logger
  name: unstructured-logger
  namespace: default
spec:
  replicas: 1
  selector:
    matchLabels:
      app: unstructured-logger
  template:
    metadata:
      labels:
        app: unstructured-logger
    spec:
      containers:
        - image: mingrammer/flog:0.4.3
          name: unstructured-logger
          args: ["--loop", "--delay", "2"]
---
apiVersion: apps/v1
kind: Deployment
metadata:
  labels:
    app: structured-logger
  name: structured-logger
  namespace: default
spec:
  replicas: 1
  selector:
    matchLabels:
      app: structured-logger
  template:
    metadata:
      labels:
        app: structured-logger
    spec:
      containers:
        - image: mingrammer/flog:0.4.3
          name: structured-logger
          args: ["--loop", "--delay", "2", "--format", "json"]
---
2) Add Fluent Bit Helm Repo
Use the command below to add the Fluent Bit Helm repository:
helm repo add fluent https://fluent.github.io/helm-charts --force-update
helm repo update
3) Override Default Configuration
Create a file called values.yaml with the following contents:
config:
  inputs: |
    [INPUT]
        Name  tail
        Tag   kube.*
        Path  /var/log/containers/*.log

  filters: |
    [FILTER]
        Name   kubernetes
        Match  kube.*

  outputs: |
    [OUTPUT]
        Name   es
        Match  kube.*
        Host  <your-elastic-host-address>
        Port  443
4) Deploy Fluent Bit
Use the command below: helm upgrade -i fluent-bit fluent/fluent-bit --values values.yaml
5) Wait for Fluent Bit Pods to Run
Ensure that the Fluent Bit pods reach the Running state. kubectl get pods
6) Verify Logs in Elasticsearch
Check the logs in Elasticsearch, It will contain both structured & unstructured logs.
This sample log entry
{ \\"host\\": \\"119.205.164.52\\", \\"user-identifier\\": \\"-\\", \\"datetime\\": \\"03\\/Sep\\/2023:14:17:17 +0000\\", \\"method\\": \\"DELETE\\", \\"request\\": \\"\\/redefine\\/matrix\\/scalable\\", \\"protocol\\": \\"HTTP\\/1.1\\", \\"status\\": 503, \\"bytes\\": 25808, \\"referer\\": \\"https:\\/\\/www.chiefdeploy.com\\/world-class\\/mindshare\\/productize\\" }is a valid JSON string, whereas the entry 245.236.20.100 - robel5766 [03/Sep/2023:14:17:14 +0000] "GET /cultivate/deliverables/brand HTTP/1.1" 205 8944 is not a valid JSON.
Apart from these two cases, there are other valid JSON messages as well. The table below provides a comprehensive overview of possible JSON message formats:
| Type | Example | Valid JSON? | Valid Structured Log? |
|
String |
“failed to connect” |
No |
No |
|
Boolean |
true |
Yes |
No |
|
Integer |
1 |
Yes |
No |
|
Float |
10.5 |
Yes |
No |
|
Array |
[ |
Yes |
Yes |
|
Object |
{ |
Yes |
Yes |
From the above table we can conclude that, when an application is configured with structured logging, it either uses an Array or an Object type for logging messages. Whereas a non-structured logger uses type String (other types are implicitly treated as strings).
Identify Invalid JSON Messages using Fluent Bit
Parsing a JSON string is the only way to validate a JSON message. Parsing a JSON string converts the string into a JSON data structure that can be manipulated programmatically.
Many programming languages have built-in functions to parse JSON string— Javascript has json.parse(), for example, and Golang has json.Unmarhsal().
Similarly, Fluent Bit can natively parse JSON messages, but the ability to send an alert on invalid JSON has to be built. Thanks to the flexibility offered by Fluent Bit, it's just a matter of adding filter and output sections in the configuration.
Note: Parsing is a CPU-intensive process. The decision to use parsing to validate JSON should be done cautiously. To address this concern, we'll also explore a simple regex-based method for validating JSON.
Structured logs typically begin and end with either curly or square brackets. We can implement a regex to verify this, and ,essages that fail will be treated as invalid JSON messages.
However, this isn't a foolproof method. If an application logs a message like {"failed to connect to database"} or [failed to connect to database], the message would pass our regex validation, but it's an invalid JSON. The chances of this occurring are quite low. However, we should still anticipate the possibility.
To summarize, we will enforce JSON validation using these two approaches:
Regex based JSON Validation:
Simple, fast, but with a slight chances of providing inaccurate resultsValidation using JSON parsing:
Simple, slower than regex-based validation, but provides accurate results.
With the prerequisites for JSON validation now elucidated, let’s implement it in practice.
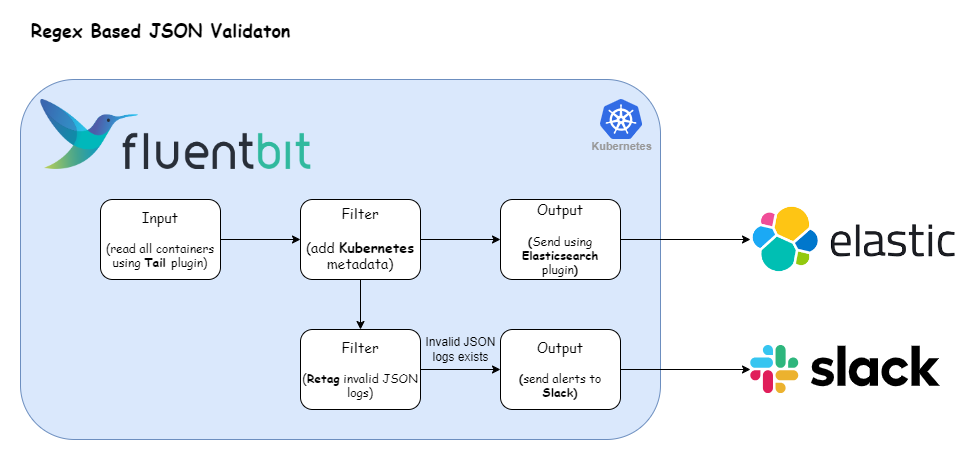
Method 1. Regex-based JSON Validation
The following illustration presents our revamped log processing pipeline designed to validate JSON logs using regex. Let’s now adapt our Fluent Bit configuration to accommodate this refined approach.
Here’s the Fluent Bit configuration that enables the log processing pipeline depicted above:
config:
  inputs: |
    [INPUT]
        Name  tail
        Tag   kube.*
        Path  /var/log/containers/*.log

  filters: |
    [FILTER]
            Name   kubernetes
            Match  kube.*
    [FILTER]
            Name   rewrite_tag
            Match  kube.*
            Rule   log ^(?!\\s*[\\[\\{].*[\\}\\]]\\s*$) failed.validation true

  outputs: |
    [OUTPUT]
            Name   es
            Match  kube.*
            Host  <your-elastic-host-address>
            Port  443
    [OUTPUT]
            name     slack
            match    failed.validation
            webhook  <your-slack-webhook-url>
Breaking down the configuration above, we define one input section:
Tail: This input section captures all container logs and tags them with
kube.*.
The filter section applies two filters:
Kubernetes Filter: This filter appends Kubernetes metadata to all logs aligned with the
kube.*tag.Rewrite Tag Filter: This section selects all the logs that match the tag
kube.*and applies a processing rule to them. The configuration value ofRulefield is mapped to the format$KEY REGEX NEW_TAG KEEP$KEY: The key represents the name of the record key that holds the value that we want to use to match our regular expression. In our case, it is
logas the record generated by tail plugin stores the log message under the key namedlog.Regex: Using this regular expression
^(?!\\s*[\\[\\{].*[\\}\\]]\\s*$), we specify a matching pattern to apply to the value of the key specified above. Here is the breakdown of the regex:^: This asserts the position at the start of a line.(?!...): This is a negative lookahead assertion. It asserts that what directly follows the current position in the string doesn't match the pattern inside the assertion. In other words, it ensures that whatever pattern is inside the lookahead does NOT exist in the string.\\s*: Matches zero or more whitespace characters.[\\[\\{]: Matches either an opening square bracket[or an opening curly bracket{..*: Matches zero or more of any character except a newline.[\\}\\]]: Matches either a closing curly bracket } or a closing square bracket ].\\s*: Matches zero or more whitespace characters.$: This asserts the position at the end of a line.
New Tag: If our regular expression matches the value of the defined key in the rule, we apply a new Tag for that specific record:
failed.validation.Keep: If a rule matches, the filter emits a copy of the record with the newly defined Tag. The
keepproperty takes a boolean value to determine whether the original record with the old Tag should be preserved and continue in the pipeline or be discarded. In our case, we will be setting it totruebecause we want to send the original records to Elasticsearch.
For more information about the rewrite_tag plugin, check the official documentation.
The output section of the configuration identifies two destinations:
Elasticsearch: This section matches all the logs generated by the input plugins and sends them to Elasticsearch.
Slack: This section matches only logs that have the tag f
ailed.validation(effectively generated byrewrite_tagfilter) and sends the log as JSON messages into the Slack channel.
This connector uses the Slack Incoming Webhooks feature to post messages to Slack channels. Before configuring this plugin, make sure to set up your Incoming Webhook. For detailed step-by-step instructions, review the following official documentation. Once you have obtained the webhook URL, substitute thewebhookfield with the acquired URL.
For more information about this plugin, check the official documentation.
To deploy the updated Fluent Bit configuration, execute the command:
helm upgrade -i fluent-bit fluent/fluent-bit --values values.yamlAfter the update, Fluent Bit will start posting messages in your Slack channel as log messages fail JSON validation.
The output will resemble the following:
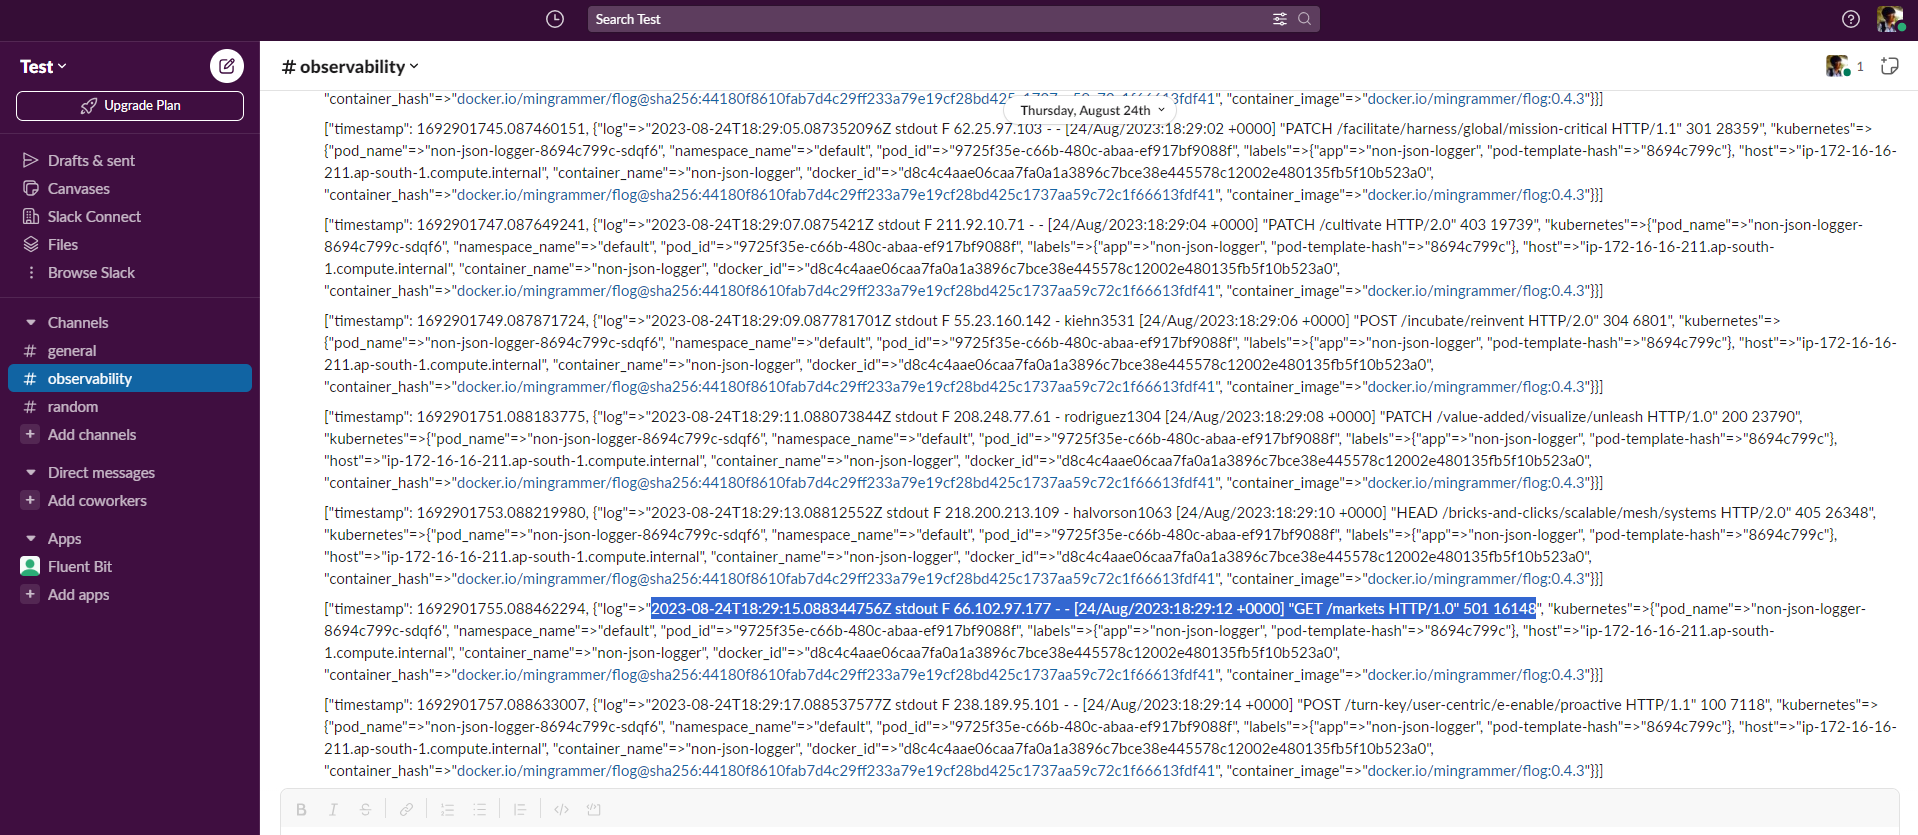
Note: An issue may arise with this approach. If there are tens of thousands of invalid JSON messages in a very short timespan. Consequently, employing this approach could bombard the Slack channel. To solve this, you can use the Throttle filter to limit the number of messages going to slack. Refer this article on how to use it
Method 2. JSON Parsing using Fluent Bit
The following illustration presents our revamped log processing pipeline designed to use JSON parser for validating messages. Let’s now adapt our Fluent Bit configuration to accommodate this refined approach.
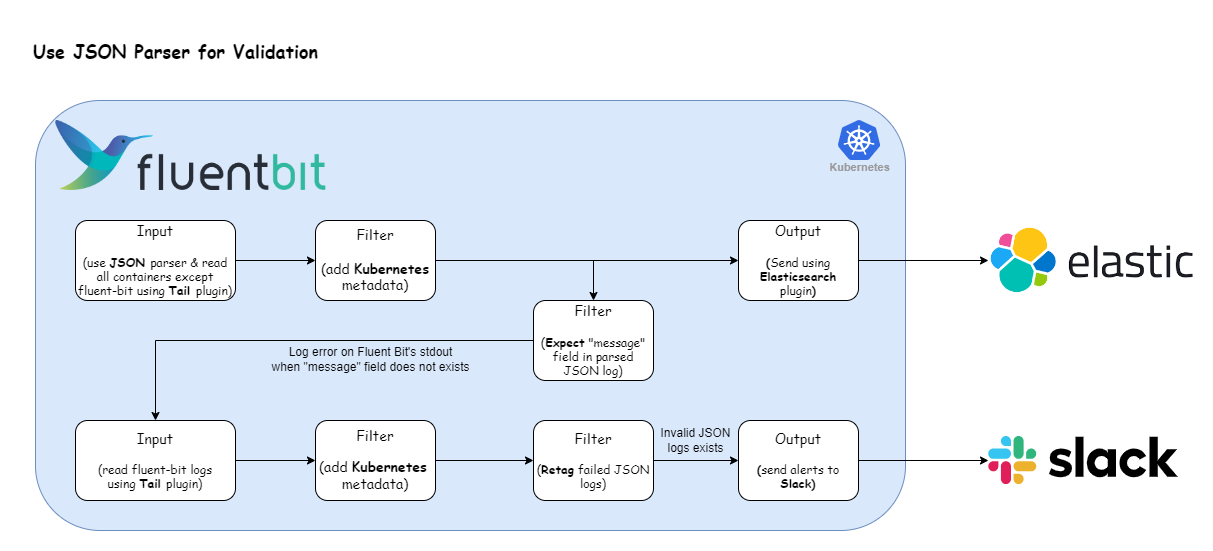
There are two important changes in this pipeline compared to the previous one. Instead of simply reading logs using the Tail plugin, we have combined it with the JSON parser and used the Expect filter to validate the JSON message.
Why not just read with the Tail Plugin?: Simply reading a log line doesn't give Fluent Bit the structured data it often needs to perform advanced log processing tasks. Without parsing, all you have is a string. By parsing a JSON formatted log, Fluent Bit can transform that string into a structured record with identifiable fields and values.
What's the purpose of the Expect filter?: When the Tail plugin and JSON parser encounter an invalid JSON message, it does not raise an error. Instead, the log message is processed as a simple string and passed along. If Fluent Bit's JSON parser processes a log record and it's formatted in JSON, we should have access to its fields. Our assumption here is that every valid JSON log will contain a "message" field or any other common field. The Expect filter leverages this behavior and checks if the common field exists. If the field is found, then it’s a valid JSON and passed along. Otherwise the filter logs an error on Fluent Bit's stdout.
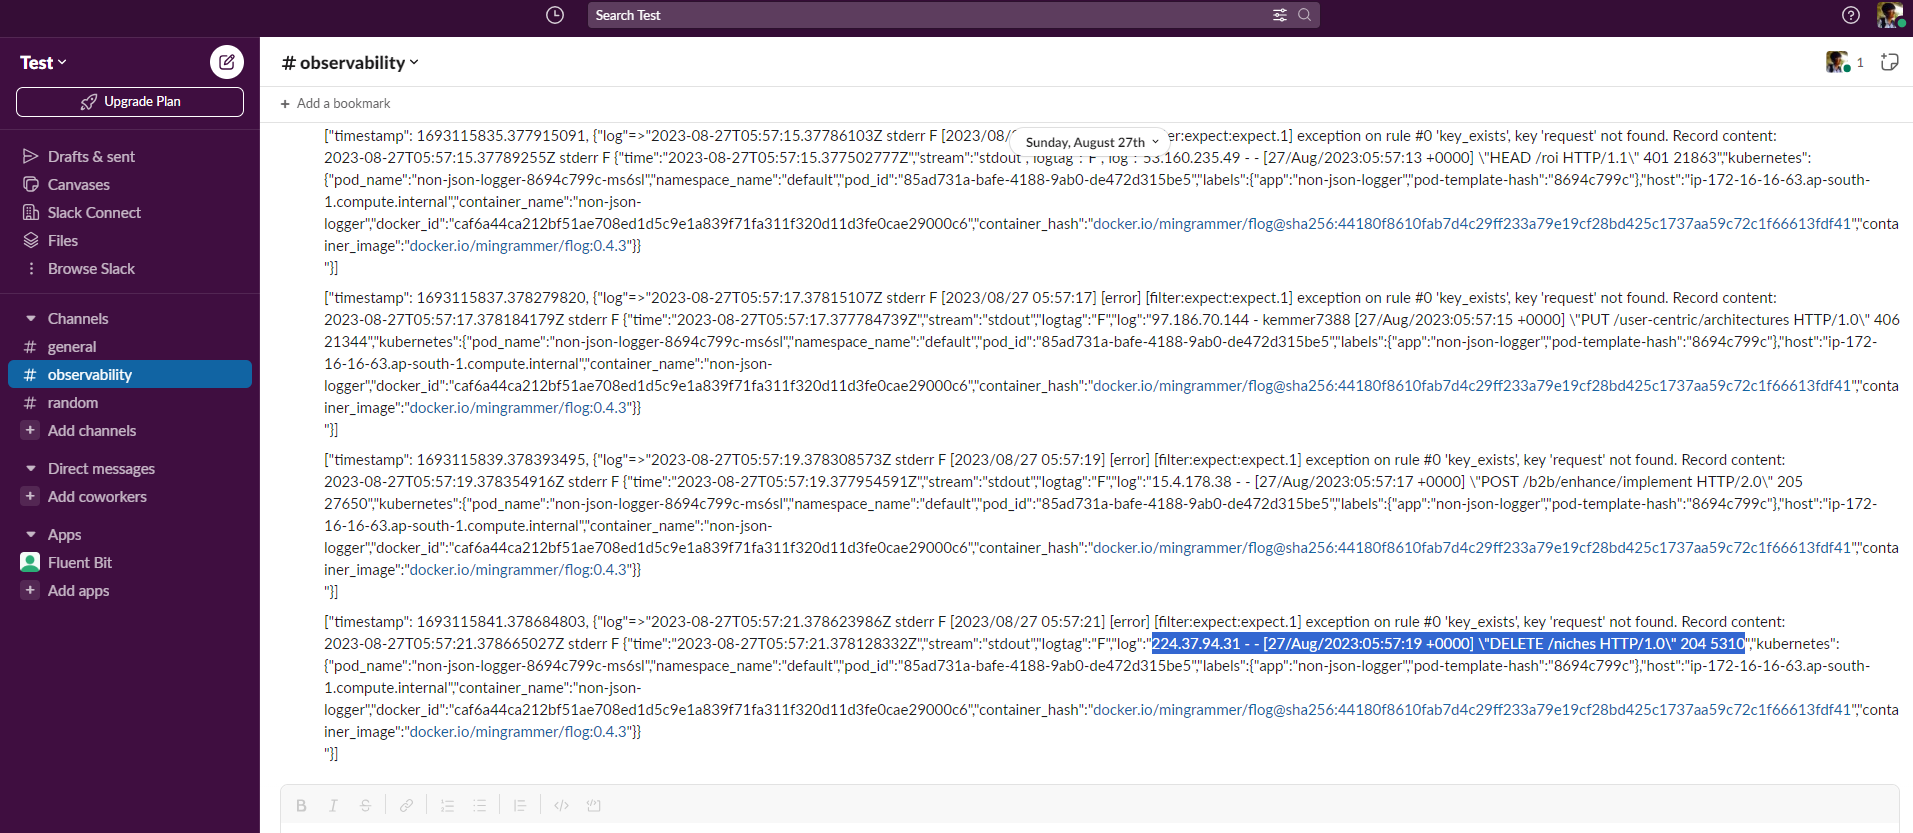
Here is a sample output of the Expect filter when it finds an invalid JSON:
[2023/09/04 14:14:38] [error] [filter:expect:expect.1] exception on rule #0 'key_exists', key 'request' not found. Record content:
{"time":"2023-09-04T14:14:38.943403225Z","stream":"stdout","logtag":"F","log":"214.49.103.55 - borer4011 [04/Sep/2023:14:14:30 +0000] \\"HEAD /proactive/deliver/relationships HTTP/2.0\\" 302 22227","kubernetes":{"pod_name":"unstructured-logger-84d858f7b-wmbm7","namespace_name":"default","pod_id":"6aa364e7-48cc-4598-9324-c199c1c3083f","labels":{"app":"unstructured-logger","pod-template-hash":"84d858f7b"},"host":"ip-172-16-18-49.ap-south-1.compute.internal","container_name":"unstructured-logger","docker_id":"25928f474e96ca86f2214b9fa49a229f24d6e00fd224cb1acda56a3ca4a20477","container_hash":"docker.io/mingrammer/flog@sha256:44180f8610fab7d4c29ff233a79e19cf28bd425c1737aa59c72c1f66613fdf41","container_image":"docker.io/mingrammer/flog:0.4.3"}}
The existence of this message in Fluent Bit’s container is treated as invalid JSON and should be sent to an alerting channel (such as Slack).
Here’s the Fluent Bit configuration that enables the log processing pipeline depicted above:
config:
  customParsers: |
    [MULTILINE_PARSER]
        Name        fluent-bit-expect-log
        type        regex
        flush_timeout 1000
        # The start state regex should match your error log line.
        rule        "start_state"   "\\[error\\]\\s\\[filter:expect:[^\\]]+\\]\\sexception\\son\\srule\\s#[0-9]+\\s'key_exists',\\skey\\s'[^']+'\\snot\\sfound." "cont"
        # The continuation state should match the following log content.
        rule        "cont"          "{\\"time\\":\\".*\\",\\"stream\\":\\".*\\",\\"logtag\\":\\".*\\",\\"log\\":\\".*\\"}"  "cont"
    [PARSER]
        Name         crijsonparser
        Format       regex
        Regex        ^(?<time>[^ ]+) (?<stream>stdout|stderr) (?<logtag>[^ ]*) (?<log>.*)$
        Decode_Field json log

  inputs: |
    [INPUT]
        Name  tail
        Tag   kube.*
        Path  /var/log/containers/*default_non-json-logger*
        Exclude_Path  /var/log/containers/*default_fluent-bit*
        Parser crijsonparser
    [INPUT]
        Name  tail
        Tag   fluent-bit*
        Path  /var/log/containers/*default_fluent-bit*
        multiline.parser  fluent-bit-expect-log

  filters: |
    [FILTER]
        Name   kubernetes
        Match  kube.*
    [FILTER]
        Name   expect
        Match  kube.*
        key_exists  request
    [FILTER]
        Name   rewrite_tag
        Match  fluent-bit*
        Rule   log \\[error\\]\\s\\[filter:expect:[^\\]]+\\]\\sexception\\son\\srule\\s#[0-9]+\\s'key_exists',\\skey\\s'[^']+'\\snot\\sfound\\. failed.validation true

  outputs: |
    [OUTPUT]
            Name   es
            Match  kube.*
            Host  <your-elastic-host-address>
            Port  443
    [OUTPUT]
            name     slack
            match    failed.validation
            webhook  <your-slack-webhook-url>
Breaking down the configuration above, we define two distinct custom parsers:
Multiline Parser
fluent-bit-expect-log: This parser handles logs that span multiple lines and treats them as a single unit. In our case, it is required to combine the multi-line error output of the Expect filter into a single log such that we can send both the error and the invalid log to Slack.
This parser checks for logs starting with an error signature and continues capturing until it finds a JSON formatted log (for reference, check the sample Expect output above).The
start_staterule matches error log lines that start with[error]and contain a specific error pattern.The
contrule matches continuation lines that are in a specific JSON format.
Parser
crijsonparser: This parser is required to handle JSON formatted logs from the Kubernetes Container Runtime Interface (CRI). It extracts the time, stream, log tag, and log message from each log entry and also decodes the log message if it's in JSON format.
The input section contains two inputs:
The first input section uses
crijsonparserand captures all container logs except those originating from the Fluent Bit container within thedefaultnamespace. We tag the logs generated from this section withkube.*.The second input section exclusively targets Fluent Bit container logs marked with the tag
kube.fluent-bit.*.
The filter section applies two filters:
Kubernetes Filter: This filter appends Kubernetes metadata to all logs aligned with the
kube.*tag—encompassing logs from both input sections.Expect Filter: The filter targets logs with the tag
kube.*and examines them for the presence of arequestfield. If the field is absent, Fluent Bit logs an error to its standard output.Retag Filter: This section selects all the logs that match the tag
kube.fluent-bit*(i.e., Fluent Bit container logs) and performs the same operation as specified in our previous pipeline, except the regex has been changed to match the error output of the Expect filter.
To deploy the updated Fluent Bit configuration, execute the command:
helm upgrade -i fluent-bit fluent/fluent-bit --values values.yamlAfter the update, Fluent Bit will start posting messages in your Slack channel as log messages fail JSON validation.
The output will resemble the following:
Conclusion
Enforcing structured logging in your applications makes it easier for your application performance monitoring (APM) tools to provide valuable insights into how your application is performing, which then helps you identify potential issues before they become major problems. By using Fluent Bit for your logging pipeline, you can ensure that your logs are formatted in a structured way that is easy to parse and analyze.
Next steps — Additional learning
If you enjoyed this post, we recommend our Fluent Bit Summer webinar series — now available on-demand — with topics such as advanced processing and routing to help you optimize your Fluent Bit usage.
We also encourage you to join the Fluent Slack community, where you can find over 10,000 fellow Fluent users. It’s a great place to turn to for a quick question or a lengthy discussion of the future of the project.
Finally, we encourage you to subscribe to the Fluent Bit newsletter, delivered to your inbox once a month and filled with the latest updates about Fluent Bit and links to the best Fluent-related content from across the web.
About Calyptia
Calyptia, the creators of Fluent Bit, offers Calyptia Core, an enterprise solution that simplifies the management of complex telemetry pipelines with a low-code and UI approach to connecting your existing agents, open source protocols, SaaS platforms, and your storage and analytic backends.
You might also like
Fluent Bit and Fluentd – a child or a successor?
Fluent Bit may have started as a sibling to Fluentd, but it is fair to say that it has now grown up and is Fluentd's equal. Learn which is right for your needs and how they can be used together.