
Fluent Bit: Alerting via Slack when the log destination is unreachable
Fluent Bit: Alerting via Slack when the log destination is unreachable
Fluent Bit is a widely-used open-source data collection agent, processor, and forwarder that enables you to collect logs, metrics, and traces from various sources, filter and transform them, and then forward them to multiple destinations.
These destination platforms usually include alerting functionality that allows engineers to identify problems with application performance or security issues.
But what if the data cannot reach your endpoint? What if there is a problem in the data pipeline itself?
Ensuring the uninterrupted flow of data is not without challenges. Network outages, misconfigurations, or bottlenecks can disrupt the seamless transfer of information, potentially leading to blind spots in monitoring and a delayed response to critical incidents.
In such scenarios, understanding and addressing issues within the data pipeline itself becomes paramount for maintaining system reliability and performance.
In this post, we will demonstrate how you can create alerts using Fluent Bit that identify irregularities in the pipeline as they occur.
Use Case: Detecting data delivery failures
One of the pivotal components within Fluent Bit is its output plugin, which undertakes the task of transmitting logs to various destinations. However, this transmission process might encounter failures due to various factors, including network glitches, authentication issues, or errors on the destination side.
Such situations can directly impede the efficiency of your logging stack. Curiously, there exists no straightforward approach to ascertain whether your logging stack is functioning as intended, unless a developer explicitly reports the unavailability of application logs.
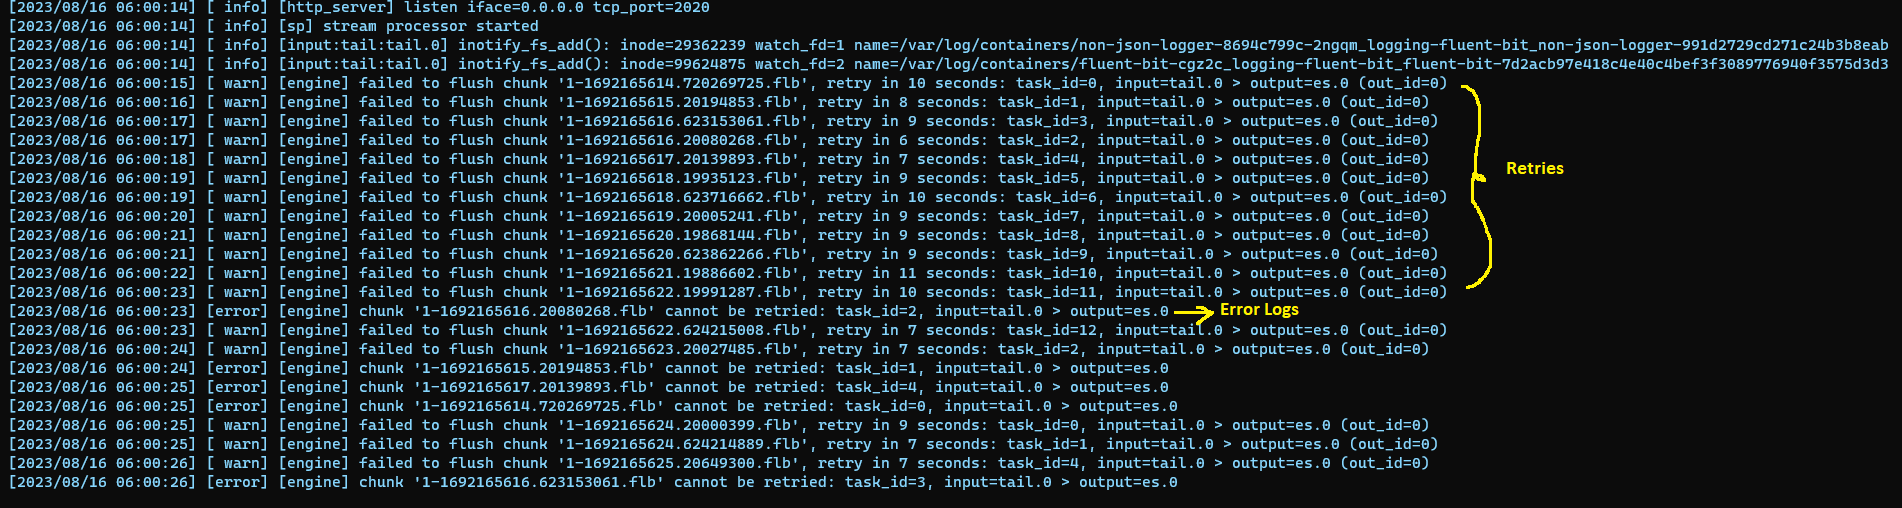
However, Fluent Bit also generates logs, so we can use them to identify delivery errors. When a destination fails to receive messages, Fluent Bit retries the delivery. After the configured retry limit is exhausted, Fluent Bit logs an error on standard output. The below image represents the error logging behavior when a destination fails.
We can use Fluent Bit’s error logging behavior to enable alerting. The underlying principle is elegantly simple: we proactively monitor logs emitted by the Fluent Bit application that serve as indicators of destination failures. Subsequently, we translate these logs into actionable alerts.
We will delve into the practical implementation of this strategy in the subsequent sections.
Prerequisites
Kubernetes Cluster: We will deploy Fluent Bit in a Kubernetes cluster and ship logs of application containers inside Kubernetes. We will be using an EKS cluster, but any cluster will suffice.
Slack Channel: We will use Slack as the destination for sending our alerts.
Kubectl and Helm CLI: Installed on your local machine.
Familiarity with Fluent Bit concepts: Such as, inputs, outputs, parsers, and filters. If you’re not familiar with these concepts, please refer to the official documentation.
Getting up to speed
Let’s start by establishing an initial configuration that mirrors the scenario where the output plugin encounters difficulties in transmitting logs to its intended destination.
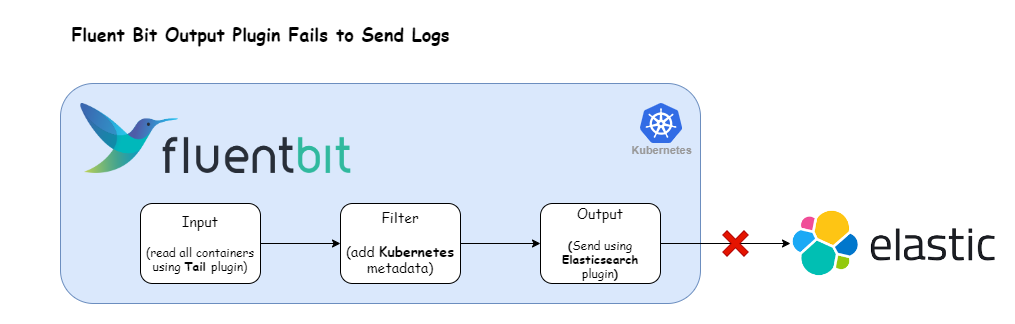
We’ll work with the following Fluent Bit configuration:
[INPUT]
        Name  tail
        Tag   kubernetes.containers.fluent-bit
        Path  /var/log/containers/*.log

[FILTER]
        Name   kubernetes
        Match  *

[OUTPUT]
        Name   es
        Match  *
In this setup, the tail plugin is utilized to ingest container logs, which are then directed to an Elasticsearch cluster using the es plugin.
Note: To simulate a scenario where log transmission fails, we deliberately omit required fields like host and port in the es output plugin. This is merely an illustrative example; actual outages can arise from various causes.
Let’s deploy the above Fluent Bit configuration using the Helm chart available at Fluent Bit Helm Chart.
Instructions:
1) Add Fluent Bit Helm Repo
Use the command below to add the Fluent Bit Helm repository:
helm repo add fluent https://fluent.github.io/helm-charts2) Override default configuration
Create a file called values.yaml with the following contents:
config:
  inputs: |
    [INPUT]
            Name  tail
            Tag   kubernetes.containers*
            Path  /var/log/containers/*.log

  filters: |
    [FILTER]
            Name   kubernetes
            Match  *

  outputs: |
    [OUTPUT]
            Name   es
            Match  *
3) Deploy Fluent Bit
Use the command below:
helm upgrade -i fluent-bit fluent/fluent-bit --values values.yaml4) Wait for Fluent Bit pods to run
Ensure that the Fluent Bit pods reach the Running state.
kubectl get pods5) Verify Fluent Bit Logs
Use the command below to check the logs of Fluent Bit
kubectl logs <fluent-bit-pod-name> -fAn error output indicating that Fluent Bit is not able to ship logs should be visible.
This entry
[2023/08/18 06:20:08] [error] [engine] chunk '1-1692339596.212851882.flb' cannot be retried: task_id=8, input=tail.1 > output=es.0clearly indicates that the logs generated from the Tail input plugin failed to reach the Elasticsearch destination.
To create any alert, we require two things:
Alert Rule: This defines the condition when the alert should be triggered. We’ll utilize Fluent Bit’s regex processing capability to evaluate its own logs for indications that an alert should be triggered.
Alert Dispatch: This defines how and where the alert should be delivered. We’ll utilize Fluent Bit’s Slack output plugin to send messages to the popular messaging app.
With the prerequisites for alerting now elucidated, let’s implement it in practice.
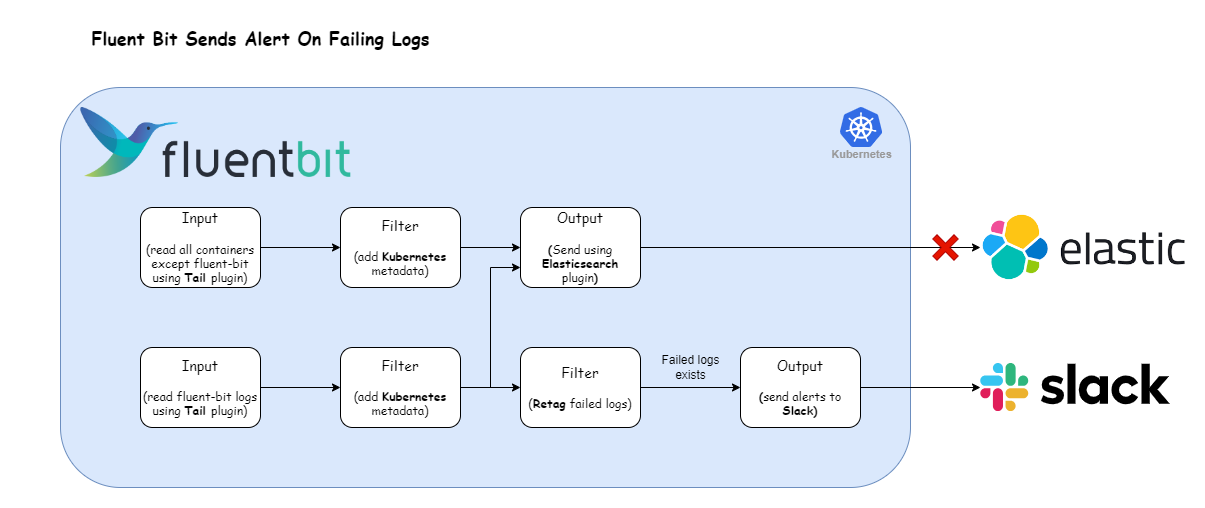
Sending alerts to Slack
The following illustration presents our revamped log processing pipeline designed to transform logs of failed destinations into actionable alerts. Let’s now adapt our Fluent Bit configuration to accommodate this refined approach.
Here’s the Fluent Bit configuration that enables the log processing pipeline depicted above:
config:
  inputs: |
    [INPUT]
            Name  tail
            Tag   kube.*
            Path  /var/log/containers/*.log
            Exclude_Path  /var/log/containers/*default_fluent-bit*
    [INPUT]
            Name  tail
            Tag   kube.fluent-bit*
            Path  /var/log/containers/*default_fluent-bit*

  filters: |
    [FILTER]
            Name   kubernetes
            Match  kube.*
    [FILTER]
            Name   rewrite_tag
            Match  kube.fluent-bit*
            Rule   log \[.*error.*\].*output=es\.(0|1) failed.destination true

  outputs: |
    [OUTPUT]
            Name   es
            Match  kube.*
    [OUTPUT]
            name     slack
            match    failed.destination
            webhook  <your-slack-webhook-url>
Breaking down the configuration above, we define two distinct input sections:
The first input section captures all container logs except those originating from the Fluent Bit container within the
defaultnamespace. We tag the logs generated from this section withkube.*.The second input section exclusively targets Fluent Bit container logs, marked with the tag
kube.fluent-bit.*.
The filter section comprises of two filters:
Kubernetes Filter: This filter appends Kubernetes metadata to all logs aligned with the
kube.*tag—encompassing logs from both input sections.Rewrite Tag Filter: This section selects all the logs that match the tag
kube.fluent-bit*(i.e., fFluent Bit container logs) and applies the regex\[.*error.*\].*output=es\.(0|1). For logs that satisfy the regex expression we apply the tagfailed.destination. The configuration value ofRulefield is mapped to the format$KEY REGEX NEW_TAG KEEP$KEY: The key represents the name of the record key that holds the value that we want to use to match our regular expression. In our case, it is
logas the record generated by tail plugin stores the log message under the key namedlog.Regex: Using a simple regular expression, we specify a matching pattern to apply to the value of the key specified above. Here is the breakdown of the regex that we used:
\[.*error.*\]matches the word “error” enclosed in square brackets, with any characters before or after it..*matches any number of characters (including none).output=es\.(0|1)matches the string “output=es.” followed by either “0” or “1”.
New Tag: If our regular expression matches the value of the defined key in the rule, we apply a new Tag for that specific record:
failed.destination.Keep: If a rule matches, the filter emits a copy of the record with the newly defined Tag. The
keepproperty takes a boolean value to determine whether the original record with the old Tag should be preserved and continue in the pipeline or be discarded. In our case, we will be setting it totruebecause we want to send the original records to Elasticsearch.
For more information about this plugin, check the official documentation.
Further down the pipeline, the output section comprises two outputs:
Elasticsearch: This section matches all the logs generated by the input plugins and sends them to Elasticsearch.
Slack: This section matches the logs that have the tag
failed.destination(effectively generated byrewrite_tagfilter) and sends the log as JSON messages into the Slack channel.This connector uses the Slack Incoming Webhooks feature to post messages to Slack channels. Before configuring this plugin, make sure to set up your Incoming Webhook. For detailed step-by-step instructions, review the following official documentation. Once you have obtained the webhook URL, substitute the
webhookfield with the acquired URL.For more information about this plugin, check the official documentation.
To deploy the updated Fluent Bit configuration, execute the command:
helm upgrade -i fluent-bit fluent/fluent-bit --values values.yamlAfter the update, Fluent Bit will start posting messages in your Slack channel as log messages fail to deliver.
The output will resemble the following:
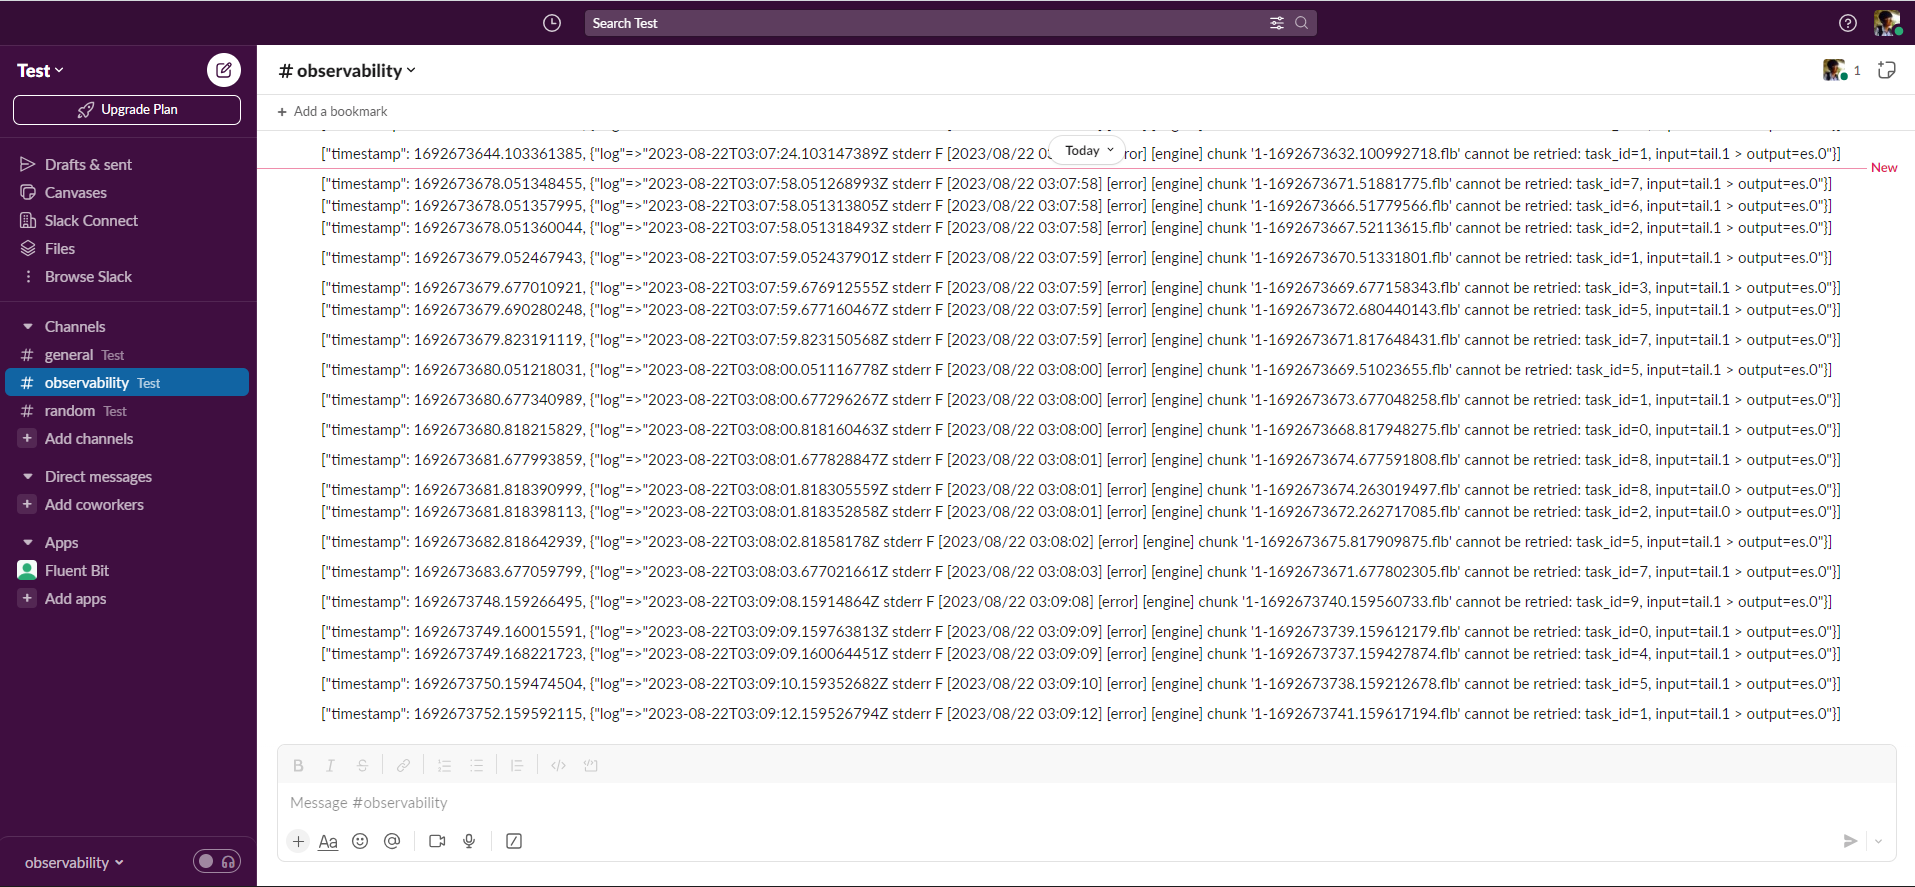
However, an issue arises with this approach. In cases where a destination is unavailable, there potentially could be tens of thousands of failed messages in a very short timespan. Consequently, employing this approach could bombard the Slack channel.
We need some way to limit the number of messages sent to Slack. Thankfully, Fluent Bit provides it.
Limiting the Slack messages
We can prevent overwhelming the Slack channel with redundant messages, the Fluent Bit throttle plugin manages the frequency of messages reaching the Slack channel and drops excessive messages based on a predetermined limit.
The revised configuration provided below incorporates the throttle filter plugin. This plugin focuses on logs tagged as failed.destination and employs throttling, meaning it reduces the number of messages by enforcing a specified limit. With this approach, the Slack plugin receives only a subset of messages for transmission to the Slack channel.
We configure the throttle plugin to send one message every 5 minutes. This rate limitation can be tailored according to your requirements. For further customization options, consult the official documentation.
config:
  inputs: |
    [INPUT]
            Name  tail
            Tag   kube.*
            Path  /var/log/containers/*.log
            Exclude_Path  /var/log/containers/*default_fluent-bit*
    [INPUT]
            Name  tail
            Tag   kube.fluent-bit*
            Path  /var/log/containers/*default_fluent-bit*

  filters: |
    [FILTER]
            Name   kubernetes
            Match  kube.*
    [FILTER]
            Name   rewrite_tag
            Match  kube.fluent-bit*
            Rule   log \[.*error.*\].*output=es\.(0|1) failed.destination true
    [FILTER]
            Name   Throttle
            match  failed.destination
            Rate 1
            Window 1
            Interval 5m

  outputs: |
    [OUTPUT]
            Name   es
            Match  kube.*
    [OUTPUT]
            name     slack
            match    failed.destination
            webhook  <your-slack-webhook-url>
To implement the updated Fluent Bit configuration, execute the command below:
helm upgrade -i fluent-bit fluent/fluent-bit --values values.yamlAfter the update, Fluent Bit will commence delivering messages to your Slack channel according to the specified rate limit. This measured approach ensures that your Slack channel is not inundated with excessive messages.
Conclusion
In summary, our guide demonstrates the power of Fluent Bit for creating an effective alert system from application logs. By refining the log processing pipeline and incorporating the throttle plugin, we achieve precise alerting to Slack channels, ensuring key information reaches recipients without inundating the channel with redundant messages. This approach enhances alert management efficiency and timely response to critical events.
Next steps — Additional learning
If you enjoyed this post, we recommend our Fluent Bit Summer webinar series — now available on-demand — with topics such as advanced processing and routing to help you optimize your Fluent Bit usage.
Calyptia, the creators of Fluent Bit, offers Calyptia Core, an enterprise solution that simplifies the management of complex telemetry pipelines with a low-code and UI approach to connecting your existing agents, open source protocols, SaaS platforms, and your storage and analytic backends.
You might also like
Fluent Bit and Fluentd – a child or a successor?
Fluent Bit may have started as a sibling to Fluentd, but it is fair to say that it has now grown up and is Fluentd's equal. Learn which is right for your needs and how they can be used together.