Visualizing Kubernetes Metrics using Fluent Bit & Grafana
Visualizing Kubernetes Metrics using Fluent Bit & Grafana
In the modern era of cloud-native applications and distributed systems, monitoring and observability have become essential for managing complex environments such as Kubernetes in production. With the rise of microservices and other modern architectures, it has become increasingly difficult to monitor the performance of each component in the infrastructure.
Any downtime or performance degradation can have a significant impact on the end-user experience, leading to revenue loss and damage to credibility. Therefore, it is crucial to implement robust monitoring and observability solutions that can quickly identify and diagnose issues before they turn into catastrophic disasters.
Kubernetes Metrics
Monitoring Kubernetes is essential to ensure its stability and performance in production environments. According to a survey conducted by the Cloud Native Computing Foundation (CNCF), 64% of organizations use Kubernetes in production, and 50% of them have more than ten containers running on the platform.
With such a large number of containers, it can be challenging to detect and diagnose performance issues without proper monitoring. Many respondents considered monitoring the biggest challenge when running Kubernetes in production.
Proper monitoring can help avoid service disruptions and outages, which can result in significant financial losses. But monitoring Kubernetes isn’t easy; there are some challenges associated with it.
Challenges in Understanding and Analyzing Kubernetes Metrics
Understanding and analyzing Kubernetes metrics can be a challenging task due to the complex nature of Kubernetes and the distributed systems that it manages. Metrics can be difficult to collect, interpret, and visualize, making it hard to identify performance issues and troubleshoot them effectively.
Let us look at some challenges that arise while analyzing Kubernetes metrics:
Volume: With numerous pods, containers, and nodes in a cluster, the volume of metrics generated can be enormous, making it difficult to sift through them and find relevant information.
Complexity: Kubernetes is a complex system, and the metrics generated are equally complex, making it challenging to understand and make sense of them.
Variability: Metrics can vary greatly depending on the type of workload and application running in the cluster, which can make it difficult to identify patterns or anomalies.
Context: Metrics alone do not provide context; they must be analyzed in the context of the system and application being monitored to provide meaningful insights.
Tooling: There are many tools available for monitoring Kubernetes metrics, but selecting the right one and configuring it can be a challenge.
To overcome the challenges in understanding and analyzing Kubernetes metrics, monitoring tools such as Prometheus, Grafana, Jaeger, and FluentBit can provide better insights.
FluentBit, for instance, is a popular open source log processor and forwarder that can be used for collecting and forwarding logs from Kubernetes pods to various destinations. In the next section, we will explore how to use Fluent Bit with Grafana to visualize Kubernetes metrics.
Monitoring Kubernetes with Fluent Bit and Grafana
We’ll now see how we can collect Kubernetes metrics using Fluent Bit, push them to Grafana, and see how we can visualize them to enable data-driven decision-making.
The setup that we’re going to use is fairly simple—we have a Minikube Kubernetes cluster with the metrics-server addon enabled and kube-state-metrics configured. The metrics server will be exposing the metrics in a Prometheus-based format at a defined endpoint. Let us see how we can use Fluent Bit to collect metrics and use Grafana Cloud to visualize the metrics.
Before you start this, make sure you have a Grafana cloud account.
Fluent Bit Configuration
You can start by deploying Fluent Bit to your Kubernetes setup. There are multiple ways to do it, but Helm is the easiest. It will deploy Fluent Bit as a DaemonSet, and you’ll be able to see the pods running.
Once installed, you need to update the configurations related to INPUTS and OUTPUTS. Read about data pipelines in Fluent Bit to understand more.
[INPUT]
    	Name prometheus_scrape
    	Host kube-dns.kube-system
    	Port 9153
    	Tag k8s
    	Metrics_path /metrics
    	Scrape_interval 2s

[INPUT]
    	Name prometheus_scrape
    	Host kube-state-metrics.kube-system.svc.cluster.local
    	Port 8080
    	Tag k8s
    	Metrics_path /metrics
    	Scrape_interval 2s
In this, we define the input as prometheus_scrape for two metrics that we want to track: kube-state-metrics (health of Kubernetes objects) and kube-dns (core-dns related metrics) and provide the path to the host along with the port. Note: You can collect metrics from other Kubernetes components like API server, kube-scheduler, etc. in a similar way.
[OUTPUT]
    	Name prometheus_remote_write
    	Host prometheus-us-central1.grafana.net
    	Match *
    	Uri /api/prom/push
    	Port 443
    	Tls on
    	Tls.verify on
    	Http_user abcf1234
    	Http_passwd abcdefgh1234
For output, we’re using prometheus_remote_write, which will send the scrapped metrics to a Grafana endpoint. The host is based on the zone where our Grafana cloud account is created.
Save these configurations and let the changes reflect.
Grafana Setup
Setting up Grafana is simple too. We’re using Grafana Cloud as it’s readily available and requires minimal configuration.
Login to your Grafana dashboard, head to data sources, and add a new data source. Choose Prometheus and provide the host details. Since we are using promethues_remote_write, the host will be based on the zone in which our account is created. In our case, it’s `prometheus-us-central1.grafana.net`. Save these details and move to the dashboard.
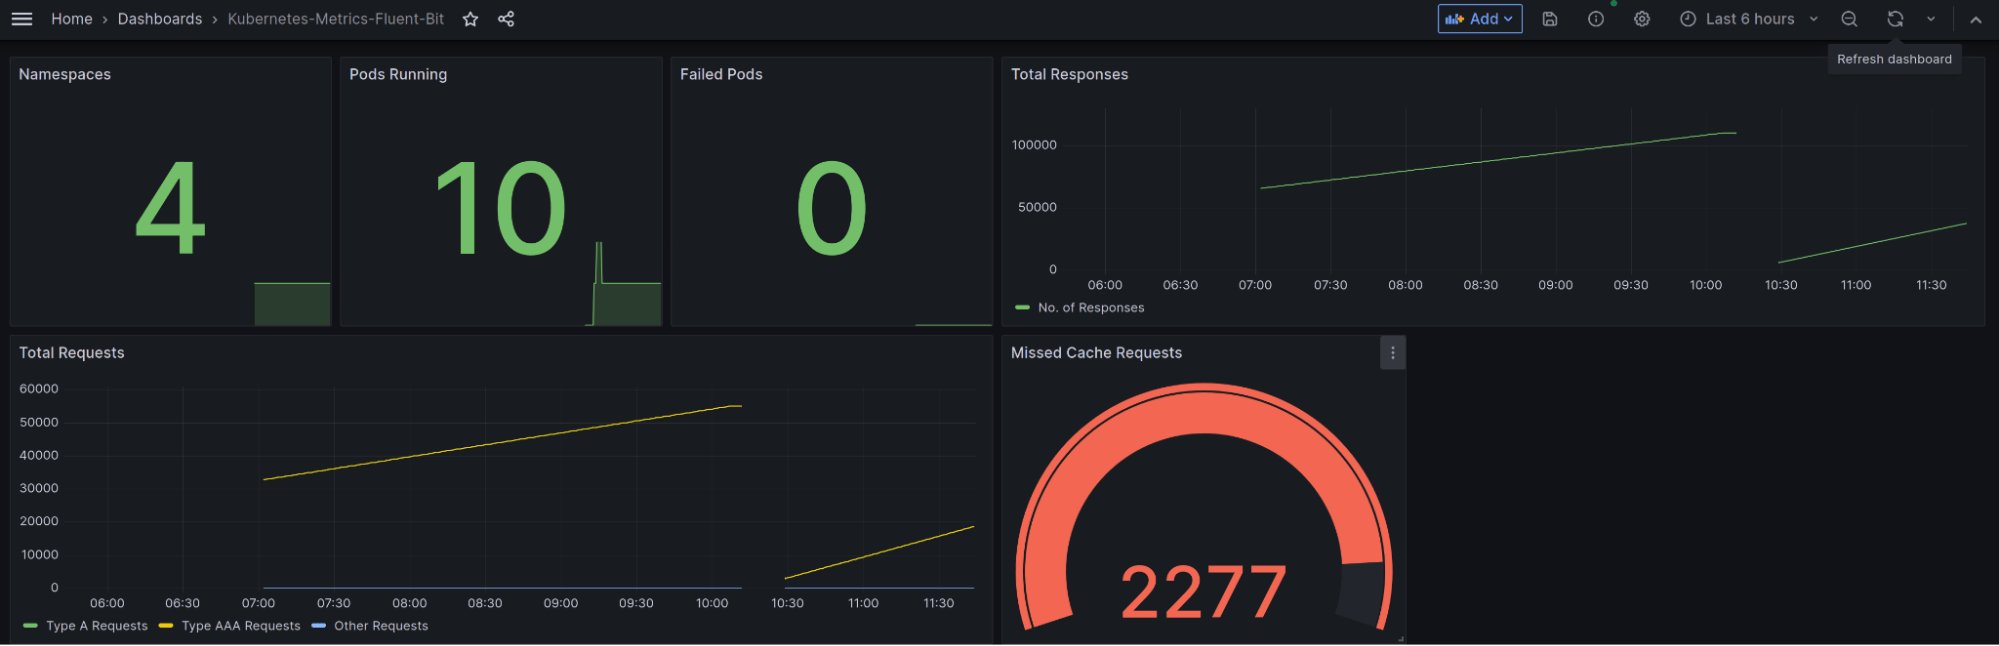
Create a new dashboard (or even easier, use this dashboard we created) for this data source, and if everything was configured correctly, you should see metrics flowing in and the panel should show the metrics.
Summary
In this blog post, we learned that visualizing Kubernetes metrics using Fluent Bit and Grafana can provide numerous benefits to organizations running complex modern cloud-native applications. We covered the steps involved in collecting and analyzing Kubernetes metrics using these tools and saw how easy it is to configure and use them.
To make things much easier and faster, you can try out Calyptia Core, which makes it easy to build pipelines and improve monitoring. It allows you to visualize your data pipelines better along with being able to collect data from multiple sources and push it to different destinations.
By implementing robust monitoring and observability solutions, organizations can quickly identify and diagnose issues before they escalate into major problems, ensuring a seamless end-user experience and maintaining credibility.
You might also like

A practical guide for avoiding data loss and backpressure problems with Fluent Bit
Learn how to detect and avoid backpressure problems with Fluent Bit by balancing memory-based and filesystem-based buffering.