How to Collect Kubernetes Component Logs Using Fluent Bit
How to Collect Kubernetes Component Logs Using Fluent Bit
Fluent Bit is a widely-used open-source data collection agent, processor, and forwarder that enables you to collect logs, metrics, and traces from various sources, filter and transform them, and then forward them to multiple destinations. In fact, if you are using Kubernetes on a public cloud provider odds are that you are already running Fluent Bit. In many cases, Fluent Bit is used to route data to the cloud providers’ backend (e.g. CloudWatch, Azure Monitor Logs, or Google Cloud Logging).
In this post, we will demonstrate how to collect logs from different Kubernetes components (such as kube-proxy, kubelet, etc.) and send them to the destination of your choice. We’ll send them to Elasticsearch, but Fluent Bit also supports more than 40 other destinations.
Note: This guide exclusively focuses on the logs of Kubernetes components. If you wish to collect logs from application containers running on Kubernetes, please refer to this guide.
Prerequisites
Kubernetes Cluster: We will be using an EKS cluster, but any cluster will suffice.
Kubectl & Helm CLI: Installed on your local machine.
Elasticsearch Cluster: Optional, but may be useful depending on your destination.
Familiarity with Fluent Bit concepts: Such as inputs, outputs, parsers, and filters. If you're not familiar, please refer to the official documentation.
Selection of Kubernetes Components
Let's begin by identifying the names of the Kubernetes components from which we need to collect the logs.
According to the official documentation of Kubernetes, Kubernetes clusters are generally composed of the following:
Control Plane Components
API Server
ETCD
Scheduler
Controller Manager
Cloud Controller Manager (Optional)
Worker Node Components
Kubelet
Kube Proxy
Container Runtime (e.g., containerd, docker)
CNI Plugins
The above list contains typical components you find in a Kubernetes cluster, but it's not necessarily an accurate starting point. Various flavors of Kubernetes exist, such as Self-Hosted, Managed Services, Openshift, Cluster API, etc. As a result, the specific component list might differ depending on the cluster you are working with.
For example, since we are using a managed Kubernetes cluster (EKS) from AWS, we don't have control over the control plane components. These are entirely managed by AWS, and the logs of these control plane nodes are available in CloudWatch directly.
However, we do have control over the worker nodes. So our component list is as shown below:
Kubelet
Kube Proxy
Container Runtime (EKS uses containerd as it's runtime)
CNI Plugin (EKS uses VPC CNI as its CNI plugin)
Suppose you were using a self-hosted Kubernetes cluster on-premises. In that case, your list would include all the components we mentioned earlier.
Moving forward, there's another complexity with the new list we've outlined: Kubernetes offers two options on how to run the control plane components. They can be executed either as a server in the host or a Kubernetes pod in a worker node (see Kubernetes docs).
For our EKS cluster, the kubelet and container-runtime run as daemon processes on the host machine, while the kube-proxy and cni-plugin run as Kubernetes pods.
Below is our final list for EKS components with some additional information attached to it.
# Below components run as Daemon Processes
1. Kubelet
   Service Name: "kubelet.service"
2. Container Runtime (containerd)
   Service Name: "containerd.service"

# Below components run as Containers
1. Kube Proxy
   Namespace: "kube-proxy"
   Resource: "daemonset"
   Resource Name: "kube-proxy"
2. CNI Plugin (VPC CNI)
   Namespace: "kube-proxy"
   Resource: "daemonset"
   Resource Name: "aws-node"
To summarize, here's a three-step process for selecting the components from which to gather logs:
Identify all the components in your cluster.
Disregard any component over which you don’t have control.
Identify where the control plane component is being run, and collect additional information about it.
With the components list ready, it's time to configure Fluent Bit.
Selecting the Input Plugin
From our components list, we can see that we have two different types of data sources: Containers and Daemon Processes. Fluent Bit offers an input plugin for each of these data sources.
Tail Plugin: For Reading Log Files
Containers store their logs in plain text files, which can be read by standard programs (like cat, tail, etc.). The Tail Plugin operates similarly to the Linux tail command, where you specify the file path as an argument to read a specific file. In this context, the plugin takes the Path as a parameter to read files on the host machine. Since we're using containerd as our container runtime, pod logs are stored in a nested directory structure at /var/log/pods.
 /var/log/pods/                             # Root directory for pod logs
|
|-- <namespace>_<pod-name>_<pod-uuid>/     # Directory for a specific pod
|   |
|   |-- <container-name>/                  # Directory for a specific container within the pod
|       |
|       |-- 0.log                          # Log file for the container's first attempt (can increment for restarts)
However, we will utilize the /var/log/containers directory, containing symbolic links to all files in the /var/logs/pods directory. This directory is preferred as it stores files in a flat structure, with no nested directories.
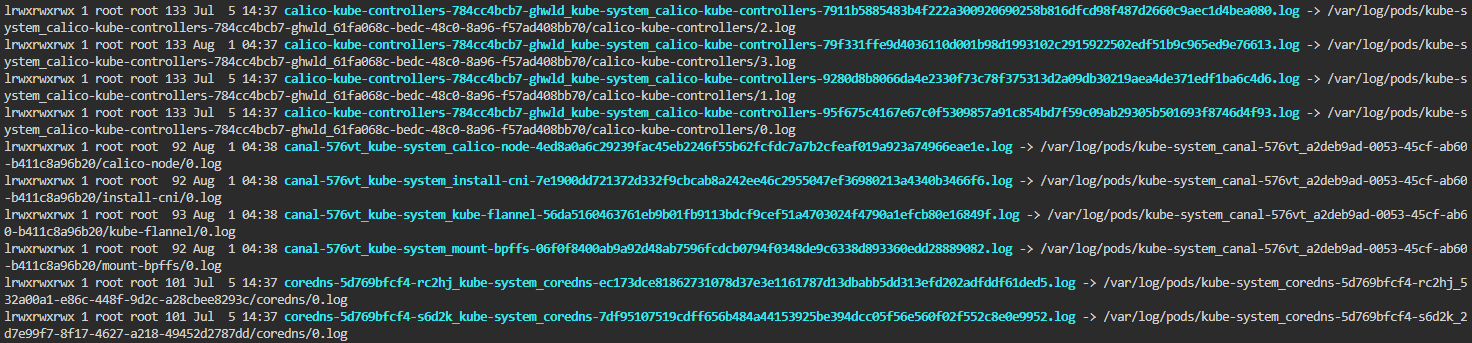
To select only aws-node and kube-proxy log files from many others in the /var/log/containers directory, we'll leverage Linux pattern matching feature. Observing the file names, we can create a pattern that selects specific files using *<namespace-name>_<pod-name>*. Our final paths for the log files will look like: /var/log/containers/*kube-system_kube-proxy*, /var/log/containers/*kube-system_aws-node*
[INPUT]
   Name  tail
   Tag   kubernetes.core.containers*
   Path  /var/log/containers/*kube-system_kube-proxy*,/var/log/containers/*kube-system_aws-node*
   multiline.parser docker, cri
   Read_from_Head true
For more information on the Tail Plugin of Fluent Bit, follow the official documentation.
Systemd Plugin: For Reading Logs of Daemon Processes
On Linux machines, daemon processes are controlled using the systemctl CLI. These processes store logs in a binary format at the /var/log/journal directory. Since the Tail Plugin cannot read these binary files directly, we use the systemd plugin, which handles format conversion and displays logs in a human-readable format. This plugin provides the Systemd_Filter parameter to specify the specific service name from which to read logs.
Our Fluent Bit configuration for the systemd plugin aligns with our component list as shown below:
[INPUT]
    Name            systemd
    Tag             kubernetes.*
    Systemd_Filter  _SYSTEMD_UNIT=kubelet.service
    Systemd_Filter  _SYSTEMD_UNIT=containerd.service
Note: If you specify a service that does not exist, Fluent Bit will implicitly ignore it.
For more information on the Systemd Plugin of Fluent Bit, follow the official documentation.
Final Fluent Bit Input Configuration
Combining both plugins, our final Fluent Bit input configuration will look like:
[INPUT]
    Name  tail
    Tag   kubernetes.core.containers*
    Path  /var/log/containers/*kube-system_kube-proxy*,/var/log/containers/*kube-system_aws-node*
    multiline.parser docker, cri
    Read_from_Head true

[INPUT]
    Name            systemd
    Tag             kubernetes.*
    Systemd_Filter  _SYSTEMD_UNIT=kubelet.service
    Systemd_Filter  _SYSTEMD_UNIT=containerd.service
Note: The above configuration is derived from our components list and the list might be different for a different Kubernetes cluster, which directly results in different configuration values but it will be along the same lines.
With our configuration ready, let's move forward and begin implementing it in Kubernetes.
Applying Configuration in Kubernetes
We will be deploying Fluent Bit using the Helm chart available at Fluent Bit Helm Chart.
Instructions:
1) Add Fluent Bit Helm Repo
Use the command below to add the Fluent Bit Helm repository:helm repo add fluent <https://fluent.github.io/helm-charts>
2) Configure Fluent Bit
The default Helm chart configuration of Fluent Bit reads container logs and sends them to an Elasticsearch cluster. Before sending logs to Elasticsearch, we would like to test the configuration, so we have added a stdout output plugin to view logs in stdout itself for verification.
3) Override Default Configuration
Create a file called values.yaml with the following contents:
config:
  inputs: |
    [INPUT]
        Name            systemd
        Tag             kubernetes.*
        Systemd_Filter  _SYSTEMD_UNIT=kubelet.service
        Systemd_Filter  _SYSTEMD_UNIT=containerd.service

    [INPUT]
        Name  tail
        Tag   kubernetes.containers*
        Path  /var/log/containers/*kube-system_kube-proxy*,/var/log/containers/*kube-system_aws-node*
        multiline.parser docker, cri
        Read_from_Head true

  outputs: |
    [OUTPUT]
        Name   stdout
        Match  *
4) Deploy Fluent Bit
Use the command below:
helm upgrade -i fluent-bit fluent/fluent-bit --values values.yaml
5) Wait for Fluent Bit Pods to Run
Ensure that the Fluent Bit pods reach the Running state.
kubectl get pods
6) Verify Fluent Bit Logs
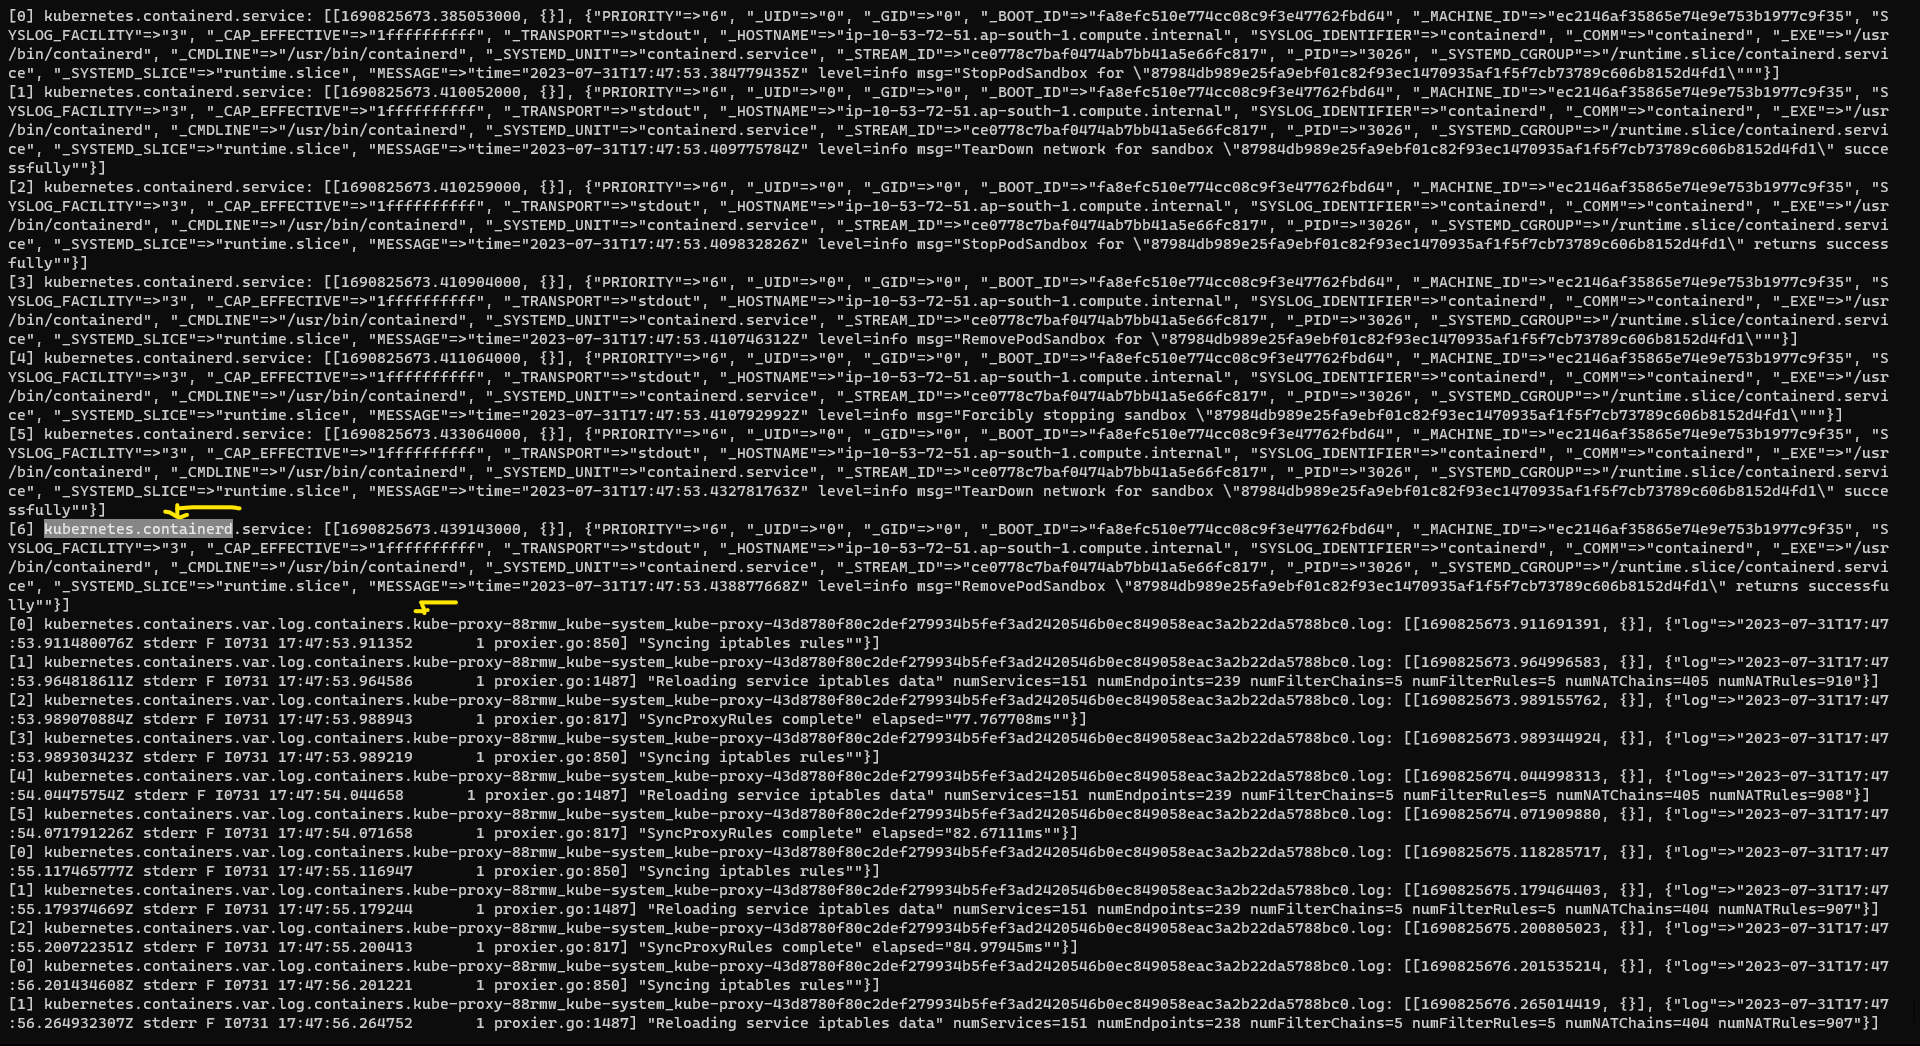
Use the command below to verify that Fluent Bit is reading the logs of the Kubernetes components that we configured:
kubectl logs <fluent-bit-pod-name> -f
Search for all the components mentioned in our list in the output.
Debugging Tips:
If you are unable to view logs of any mentioned Kubernetes components, check the following:
Ensure these two host volumes are attached to the Fluent Bit pod:
/var/log/and/etc/machine-id.SSH into your machine and verify if the daemon processes are running with the same names mentioned in the configuration. Validate using the following command:
systemctl | grep “kubelet.service\\|containerd.service”(orsystemctl status <service-name>).
Sending Logs To Elasticsearch
With a working configuration, we can now send this data to any available Fluent Bit output plugins. Since we decided to send data to Elasticsearch, modify the output configuration in values.yaml by adding the **es** output plugin, and then apply the configuration using helm apply
For more information on ES plugin check the official documentation.
config:
inputs: |
[INPUT]
Name systemd
Tag kubernetes.*
Systemd_Filter _SYSTEMD_UNIT=kubelet.service
Systemd_Filter _SYSTEMD_UNIT=containerd.service
[INPUT]
Name tail
Tag kubernetes.containers*
Path /var/log/containers/*kube-system_kube-proxy*,/var/log/containers/*kube-system_aws-node*
multiline.parser docker, cri
Read_from_Head true
outputs: |
[OUTPUT]
Name es
Match *
Host <your-host-name-of-elastic-search>
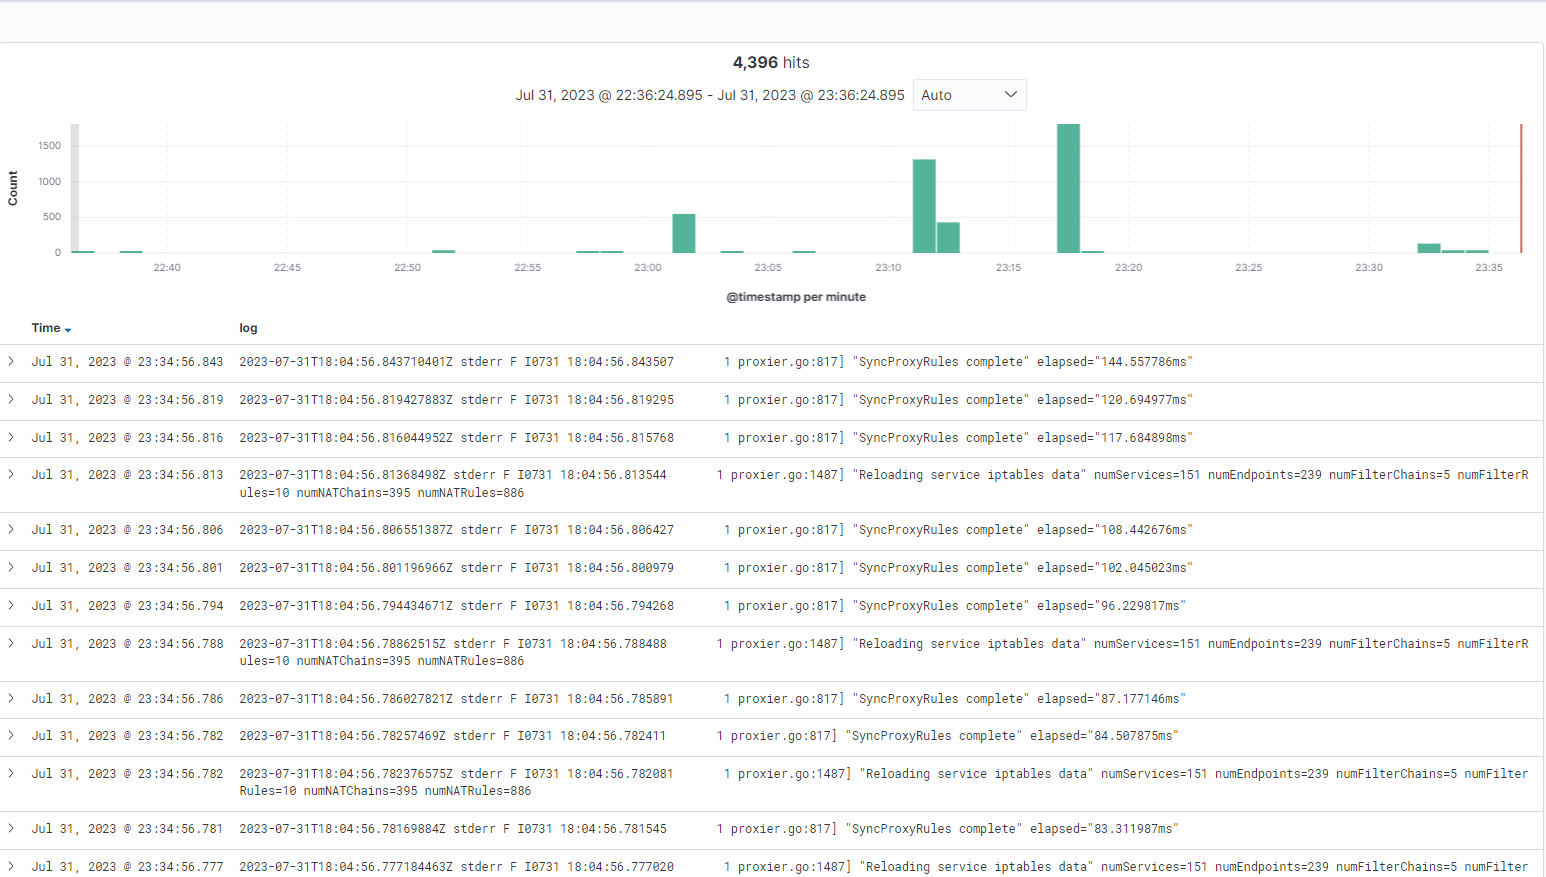
Logstash_Format On
Retry_Limit FalseAnd you should be able to see logs in elastic search.
Conclusion
This guide provided a comprehensive overview of configuring and deploying Fluent Bit in a Kubernetes environment to manage logs from containers and daemon processes. By utilizing the Helm chart along with specific input and output plugins, administrators can streamline log management and forwarding, ensuring vital data is accessible and analyzable.
Next steps
If you are new to Fluent Bit, we provide free hands-on learning labs using ephemeral sandbox environments. For more advanced users, we recommend our Fluent Bit Summer webinar series with topics such as advanced processing and routing to help you optimize your Fluent Bit usage. All webinars are available on-demand following the live presentation.
Calyptia, the creators of Fluent Bit, offers Calyptia Core, an enterprise solution that simplifies the management of complex telemetry pipelines with a low-code and UI approach to connecting your existing agents, open source protocols, SaaS platforms, and your storage and analytic backends.
You might also like

Statement on CVE-2024-4323 and its fix
We'd like to make sure you’re aware of a security vulnerability (known as CVE-2024-4323) that impacts Fluent Bit versions 2.0.7 through 3.0.3. The latest version of Fluent Bit, version 3.0.4, fixes this issue.