Highlights and Takeaways from Observability Day at KubeCon EU 2023
Highlights and Takeaways from Observability Day at KubeCon EU 2023
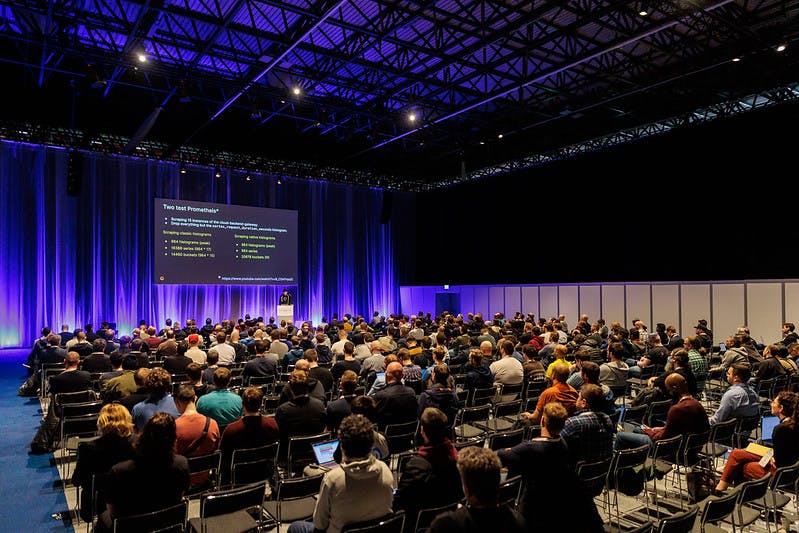
The Calyptia team returned this week from KubeCon EU 2023, which was attended by over 10,000 open source community members. A highlight of the trip was Observability Day, a co-located event for which Calyptia was a Diamond-level sponsor.

Below we’ve gathered some of the highlights and key takeaways. For those who were unable to attend, all of the session videos are posted on the CNCF’s YouTube channel.
Project Updates
Prometheus
The big news from Prometheus is the availability of native histograms as of v2.40. The feature is still experimental, but it promises to be a significant advancement for using histograms with more efficient storage, better accuracy of queries, and greater flexibility in general. Björn Rabenstein of Grafana Labs gave a very interesting presentation that is worth checking out.
OpenTelemetry
The OpenTelemetry project is working steadily toward applying for graduated status in CNCF, which is not surprising to anyone given how rapidly the project has grown and been embraced in production.
The big news from Observability Day, though, was the joint announcement that Elastic is contributing its Elastic Common Schema (ECS) to OpenTelemetry and committing to the joint development of a common schema. This is huge news for observability practitioners and a strong statement in support of open standards.
Fluent Bit
The big news from Fluent Bit was the addition of hot reload support with the release of v2.1. Configuration changes can now be applied with SIGHUP or an API call without having to restart the service. This greatly simplifies the management of large-scale installations.
The new release also adds the ability to create metrics such as counters, gauges, and histograms from log data, which is really cool. In addition, Podman containers are now supported, as well as new options for enriching logs with metadata.
Finally, the team announced that Fluent Bit had surpassed 6.3 billion downloads! It was just over a year ago that Fluent Bit surpassed one billion downloads, truly a remarkable growth rate.
Observability is Still Too Complex
Throughout the sessions on Observability Day, a few common themes emerged. One was that observability is still too difficult in practice and that complexity is hindering wider adoption. This was particularly evident in the panel discussion on “The Present and Future of Open Source Observability” featuring Alex Boten from Lightstep, Lili Cosic recently with HashiCorp and an advisor to Polar Signals, Juraci Paixão Kröhling of Grafana Labs, Anthony Mirabella from AWS, and Alolita Sharma from Intel.
Their discussion touched upon the need for a common query language, for continued evolution and adoption of standards, and for better visualizations to help make sense of the data—all of which speak to just how difficult observability is to actually do currently.
It’s interesting to note, as well, that each of the project updates above includes at least one element that aims to simplify the use of the project, so the community is responding to the need, but there is still a lot of work to be done.
Observability is Still Too Expensive
The elephant in the room, according to one audience member during a Q&A session, is that the growth of observability data results in great costs and many organizations are struggling to justify the expense, especially in light of recent economic turns. Gustavo Pantuza’s presentation showed how VTEX is ingesting 6.5TB of telemetry data per day. That’s a lot of data, and while Pantuza didn’t go into the cost it has to substantial. And if you think logs, metrics, and traces are a lot, just wait until you start incorporating eBPF data into your observability efforts. As Anna Kapuscinska of Isovalent pointed out in her presentation, “the data volume can be absurd.”
Part of the solution is to shift left, process the data as early as possible in the pipeline, and drop what is nonessential before it lands in expensive storage and analytic backends. But of course, users must understand what they can drop and have the tools that allow them to easily see into their data streams and process the data in the flow.
How Calyptia Can Help
As the creators and maintainers of Fluent Bit, Calyptia is keenly aware of the challenges facing organizations and users during their observability journey. Calyptia Core, our enterprise solution, addresses the first mile of observability — the telemetry pipeline that collects, processes, transforms as needed, and routes your data to your SIEM or observability platform. Calyptia doesn’t replace your existing toolset; we enhance it while simultaneously simplifying the management of your telemetry platform.
We’ll be happy to provide a demo and a discussion of how we can address your specific observability pain points, including reducing high costs.
You might also like

Observability Day at Kubecon + CloudNativeCon North America 2023
Calyptia is proud to sponsor Observability Day, a co-located event during Kubecon + CloudNativeCon North America 2023 to be held on November 6, 2023, in Chicago, IL.
