Beginner’s Guide to Observability and Monitoring in Kubernetes
Beginner’s Guide to Observability and Monitoring in Kubernetes
With the increasing complexity of modern applications and infrastructure, observability is critical for ensuring that the application is available, scalable, reliable, and resilient. Constantly keeping an eye on metrics, understanding logs, and exploring the traces are key activities in ensuring that your application runs smoothly.
While application monitoring is important, infrastructure monitoring is even more critical. Unfortunately, when it comes to Kubernetes, things become even more complex due to the complex architecture of Kubernetes that makes observability challenging. Nonetheless, Kubernetes components are designed with built-in support for metrics, logs, and traces, which can significantly simplify monitoring your infrastructure.
In this blog post, we’ll explore observability in Kubernetes along with the metrics, traces, and logs generated by Kubernetes components and how they help in monitoring the system better.
Observability in Kubernetes
As Kubernetes has become the de facto standard for container orchestration, understanding how to effectively observe and monitor the performance and health of your Kubernetes cluster has become essential. We all know about the three pillars of Observability: Metrics, Logs, and Traces. Kubernetes components, too, generate these types of data so that you can effectively monitor your cluster.
With metrics, you can gather quantitative data about various aspects of your cluster’s performance, such as resource utilization, workload health, and network traffic. Logs provide valuable insights into the operational behavior of containers, pods, and nodes, enabling you to troubleshoot issues and gain visibility into system events. Traces allow you to trace the flow of requests and identify performance bottlenecks in distributed applications.
Together, these observability features provide a powerful toolkit for understanding the inner workings of your Kubernetes cluster and ensuring the reliability and performance of your applications in a dynamic containerized environment.
While this is a high-level overview of how metrics, logs, and traces work in Kubernetes, we’ll understand all the major components in Kubernetes and the type of data they generate from an observability point of view.
Understanding Core Components of Kubernetes
Kubernetes components can be briefly categorized into two major categories:
Control plane components
Node components
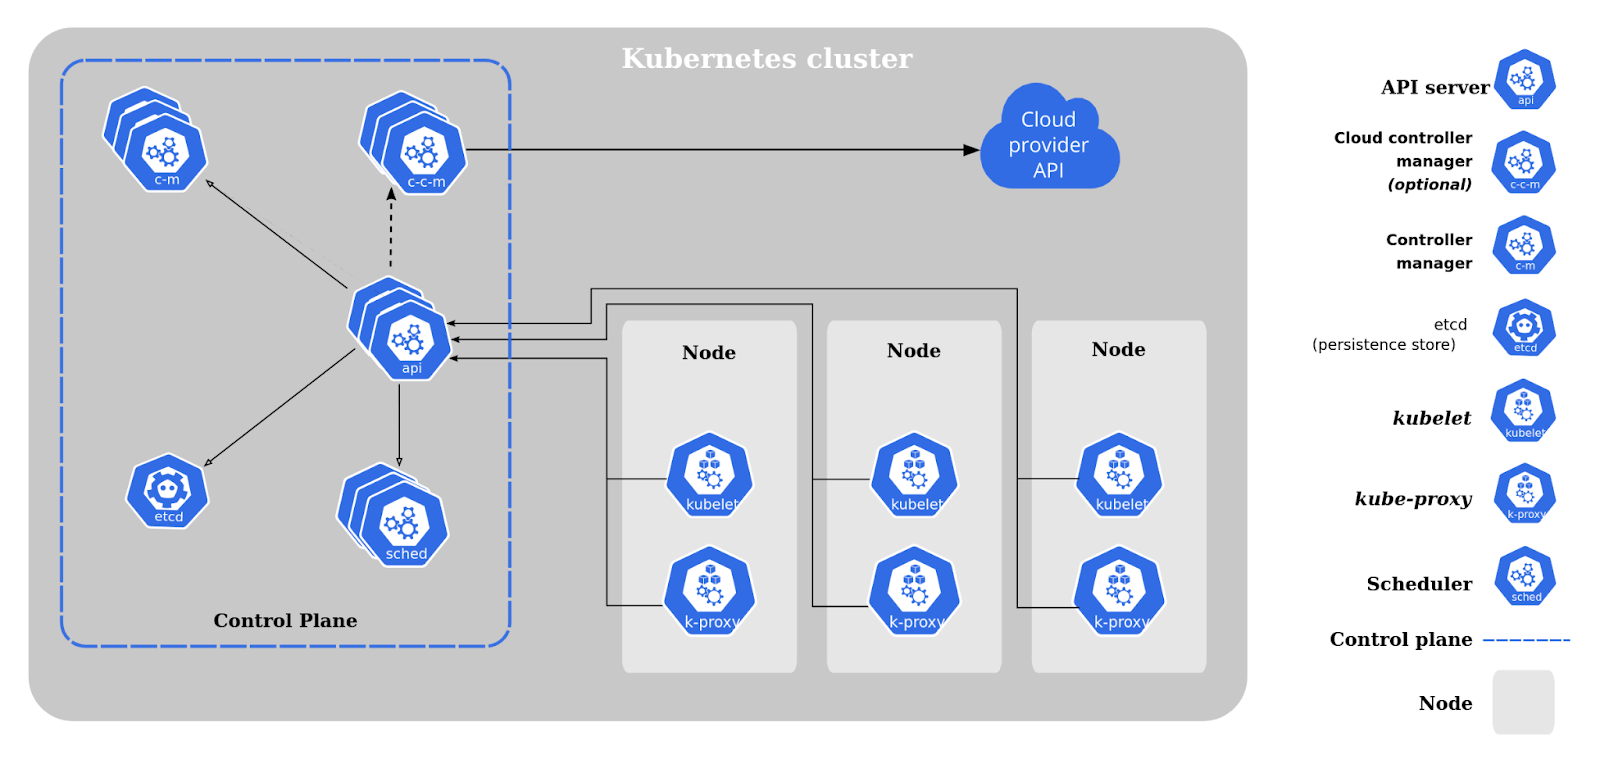
Control Plane Components
Control plane components are responsible for managing the overall state and configuration of the cluster, as well as ensuring that the desired state of the applications running on the cluster is maintained.
The various control plane components are:
etcd: A distributed key-value store that stores the configuration data of the cluster, such as cluster state, configuration settings, and metadata.
kube-api-server: The entry point for all Kubernetes API requests, responsible for authenticating and validating API requests and updating the etcd store accordingly.
Controller Manager: Ensures the desired state of the cluster by managing various controllers that automate tasks such as scaling, self-healing, and rolling updates. There are further types of controller managers like kube-controller-manager & cloud-controller-manager
kube-scheduler: Responsible for distributing workloads across nodes based on resource availability, constraints, and other policies.
Node Components
Node components are responsible for managing individual worker nodes in the cluster where containers are actually deployed and run. These components ensure the containers are properly scheduled, executed, and monitored on the nodes.
The various node components are:
kubelet: Runs on each node and communicates with the API Server to ensure that containers are running as expected, monitors their health, and reports node status.
Container Runtime: Executes containers, manages their lifecycle, and provides isolation and security for containerized workloads. Popular container runtimes in Kubernetes include Docker, containerd, and cri-o.
kube-proxy: Manages networking rules on each node, such as load balancing, routing, and network address translation (NAT), to enable communication between containers and services running on different nodes.
Add-ons: Additional components that can be deployed on nodes to provide additional functionalities, such as DNS, Dashboard, and Container Network Interface (CNI) plugins for networking.
For a more in-depth understanding, refer to the official Kubernetes components document.
Having briefly understood the various core components of Kubernetes, let us now see how each component helps make observability easier.
Kubernetes Observability: Metrics, Logs & Traces
Observability in Kubernetes involves collecting, analyzing, and visualizing metrics, logs, and traces shared by various Kubernetes components, including control plane and node components. These insights help operators and developers understand the state, health, and performance of the cluster, troubleshoot issues and optimize resource utilization.
In this section, we’ll see that various types of metrics, logs, and traces are generated by each component.
Metrics
Kubernetes components generate metrics in a Prometheus-compatible format, which is structured plain text that is easily readable by humans and machines alike. These metrics are typically exposed through the “/metrics” endpoint of the HTTP server, allowing them to be scraped by Prometheus for monitoring and analysis. In cases where a Kubernetes component does not expose the metrics endpoint by default, it can be enabled using the “–bind-address” flag.
Some of the metrics generated are:
API server metrics: These metrics measure the performance and health of the Kubernetes API server, such as request latency, error rates, and resource utilization.
etcd metrics: These metrics provide insights into the performance and health of the etcd datastore used by Kubernetes for storing configuration data, such as read/write latencies, disk utilization, and leader election status.
Controller manager metrics: These metrics measure the performance and health of the Kubernetes controller manager, such as the number of reconciliations, processing time, and error rates.
Scheduler metrics: These metrics provide insights into the performance and health of the Kubernetes scheduler, such as scheduling latency, number of pods scheduled, and node utilization.
Below are some examples of metrics generated by Kubernetes:
kube_node_cpu_usage_seconds_total: total CPU usage in seconds by a nodekube_pod_container_resource_usage_memory_bytes: memory usage in bytes by a container within a podkube_apiserver_request_latencies_seconds: latency in seconds of API requests to the Kubernetes API servercontainer_cpu_usage_seconds_total: total CPU usage in seconds by a container within a podkube_proxy_sync_proxy_rules_latency_seconds: latency in seconds of syncing proxy rules in kube-proxy
Logs
Logs generated by Kubernetes system components capture events occurring in the cluster and are invaluable for debugging purposes. You can configure the verbosity level of these logs to control the amount of detail captured. They can range from high-level error information within a component to granular step-by-step traces of events, such as HTTP access logs, pod state changes, controller actions, or scheduler decisions.
The Kubernetes logging library, called klog, is responsible for generating log messages for the system components, providing insights into the operational behavior of the Kubernetes cluster. These logs are usually in the form of key-value pairs.
Let us see some logs generated by Kubernetes:
Cluster-level logs: Events that occur at the cluster level, such as cluster startup/shutdown, control plane component activities, and cluster-wide resource changes.
Node-level logs: Activities specific to individual worker nodes in the cluster, such as node status, system component logs (e.g., kubelet, container runtime), and node-level resource utilization.
Container logs: Events and activities related to the containers running within pods, such as application logs, error messages, and container lifecycle events.
Pod logs: Activities related to individual pods, such as pod startup/shutdown events, pod status changes, and pod-level resource utilization.
Event logs: Events related to changes in the state of Kubernetes resources, such as deployments, services, and ingress rules, providing visibility into resource creation, modification, and deletion events.
Audit logs: Actions related to user activities within the Kubernetes cluster, such as authentication, authorization, and resource access, providing insights into the actions performed by users and the resulting effects on the cluster.
Below are examples of some types of logs generated along with examples:
kube-apiserver logs:I0420 10:30:45.1234567890 apiserver.go:123] Successfully authenticated user "john.doe" with clientIP=192.168.1.100kube-controller-manager logs:I0420 10:30:45.1234567890 controller.go:234] Successfully reconciled replica set "my-replica-set" in namespace "my-namespace"kube-scheduler logs:I0420 10:30:45.1234567890 scheduler.go:567] Successfully scheduled pod "my-pod" to node "worker-node-1" in namespace "my-namespace"kubelet logs:I0420 10:30:45.1234567890 kubelet.go:789] Successfully pulled container image "nginx:latest" for pod "my-pod" in namespace "my-namespace"container runtime logs:time="2023-04-20T10:30:45.1234567890Z" level=info msg="Container started" container_id="abcd1234" container_name="my-container" image="nginx:latest"
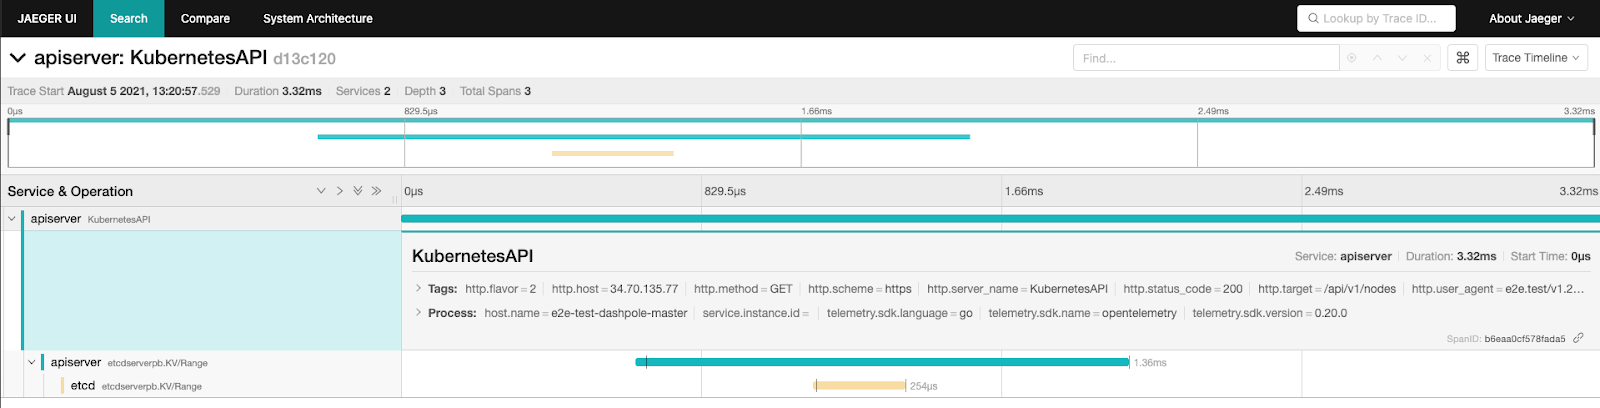
Traces
Kubernetes components generate traces using the OpenTelemetry Protocol (OTLP) with the gRPC exporter, which can be collected and directed to tracing backends with the help of an OpenTelemetry Collector. Typically, Kubernetes components export traces with the grpc exporter for OTLP on port 4317.
Let us look at the various types of traces generated by Kubernetes:
kube-api-server traces: The kube-apiserver creates spans for incoming HTTP requests, as well as for outgoing requests to webhooks, etcd, etc.
kubelet traces: Kubelet traces provide insights into the interactions and operations performed by the kubelet, such as container runtime operations, image pulling, and pod lifecycle events.
In order to enable tracing, you must create a tracing configuration, which determines which traces will be generated. You might also have to enable some feature-gates — APIServerTracing, KubeletTracing — to enable tracing. Lastly, the tracing functionality is still under active development and may change over time. Read more about traces for Kubernetes components.
All in all, we saw how metrics, traces, and logs generated by various Kubernetes components help in making the infrastructure more observable. Monitoring the health of the infrastructure becomes easier with these, as does taking corrective measures.
Summary
Observability is a critical aspect of Kubernetes infrastructure management. With its complex architecture and numerous components, monitoring, and troubleshooting can become quite challenging without proper observability.
However, Kubernetes components emit various types of metrics, logs, and traces, which can be collected and analyzed to gain valuable insights into the performance and behavior of the infrastructure.
Keep an eye out for our upcoming blog post where we’ll show you how to collect Kubernetes metrics and visualize them for better monitoring and decision-making.
You might also like

Statement on CVE-2024-4323 and its fix
We'd like to make sure you’re aware of a security vulnerability (known as CVE-2024-4323) that impacts Fluent Bit versions 2.0.7 through 3.0.3. The latest version of Fluent Bit, version 3.0.4, fixes this issue.