Troubleshooting your Fluent Bit Configuration with Calyptia Cloud
Troubleshooting your Fluent Bit Configuration with Calyptia Cloud
Note: Calyptia Cloud has been integrated into Calyptia Core. Some of the specifics in this article may be different in Core. You can create a free Calyptia Core account.
Introduction
Calyptia Cloud is our hosted solution optimizing observability pipelines utilizing open source Fluent Bit or Fluentd. It provides a unified, vendor-neutral control plane for visualizing, managing, and monitoring your observability pipelines. It allows users to focus on gaining the most insights and value out of their data pipelines in cloud-native environments.
Creating an account is free and lets you connect and monitor up to five Fluent Bit or Fluentd installations.
Today, however, we will be looking at one particular feature of Calyptia Cloud that we have heard from our users adds a lot of value: the Config Visualizer. This tool helps you to
Visualize the observability pipeline you are trying to set up.
Troubleshoot your Fluent Bit configuration files by validating them against common errors
All you have to do is copy and paste your config file. You don’t even need to have a running installation of Fluent Bit to use the tool, making it particularly useful both for beginners as well as seasoned Fluent Bit users trying to debug a complex pipeline configuration.
In this post, I’ll demonstrate how to use the Config Visualizer feature of Calyptia Cloud with several examples of increasing complexity.
Getting Started
First, you’ll need a free Calyptia Cloud account:
Create an account or log in to your existing account
Once you have logged in, navigate to the Config Visualizer tool.
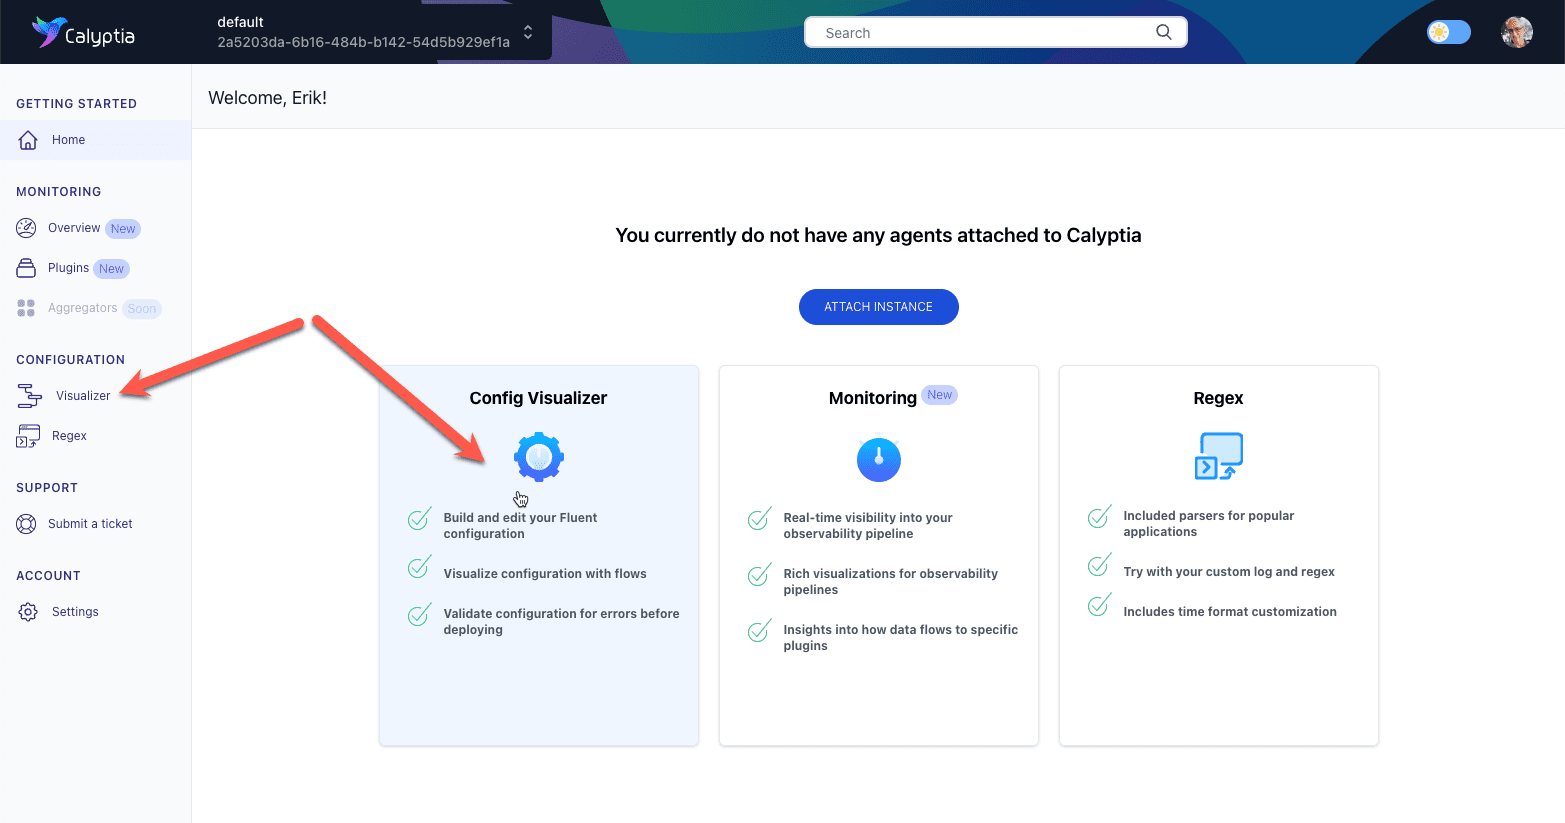
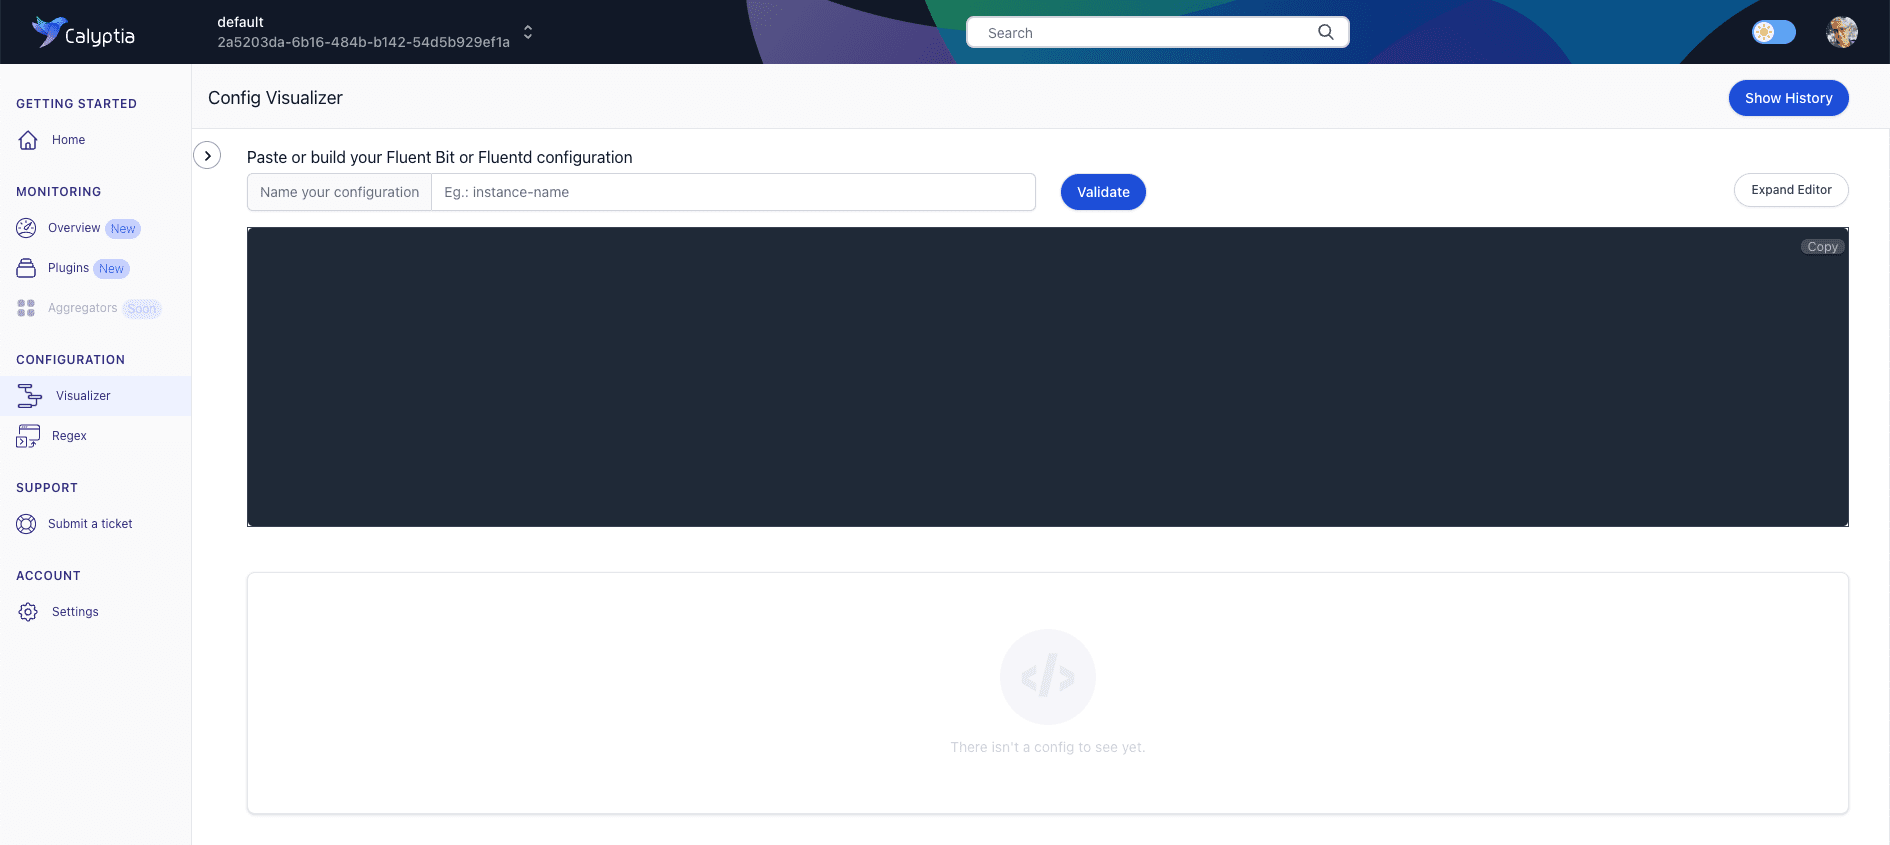
And you should see the tool.
Sample: Sending Log Files to S3 and Splunk
We’ll start with an easy one. Copy the configuration below, paste it into the editor, and hit the “Validate” button. You can also provide a name for the configuration, although it is not required.
[INPUT]
    Name    tail
    path    /home/ec2-user/test/*.log
    tag     sample.1
[FILTER]
    name    grep
    match   *
    regex   log ^(\[ERROR\]).*
[OUTPUT]
    Name    s3
    Match   *
    bucket  eb-co-calyptia-cf-template
    region  us-east-1
    total_file_size  50M
    upload_timeout  1m
    compression  gzip
    s3_key_format  /fluent-bit-logs/$TAG/%Y/%m/%d/%H/%M/%S
    use_put_object  On
[OUTPUT]
    Name    splunk
    Match   *
    host    18.118.66.88
    port    8088
    splunk_token  xxxxxxxx-xxxx-xxxx-xxxx-xxxxxxxxxxx
    splunk_send_raw  On
    tls  on
    tls.verify  off
Here we are taking log files from an EC2 instance, filtering them to retain only those that contain an error message, and sending them to both S3 and Splunk for storage and analysis.
Your screen should look something like this.
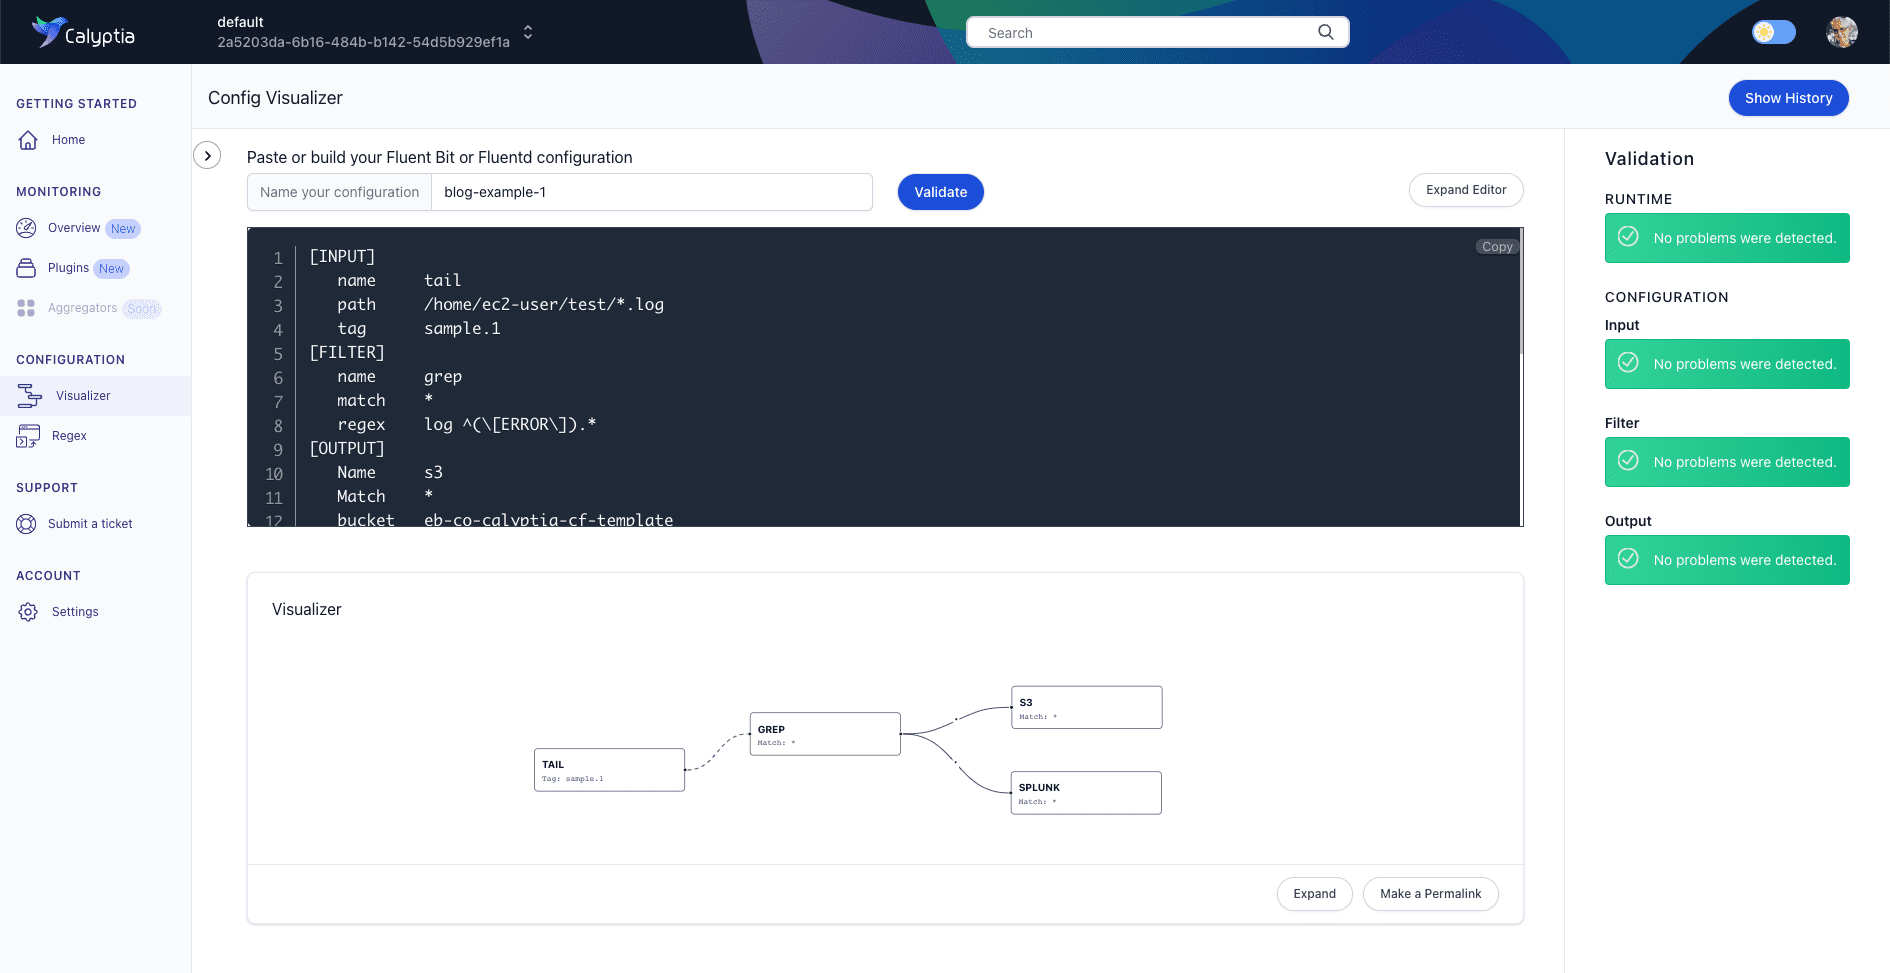
First, on the right-hand side of the screen, we can see that our config file passed validation checks without any issues being detected.
Beneath the editor is the visualization of our observability pipeline showing our data source, Fluent Bit’s filtering of the data, and its dual destinations.
Everything looks good!
Troubleshooting Your Observability Pipeline Configuration
As your observability pipelines grow more complex with multiple tags, filters, and parsers applied to deliver the exact data you need to all of the places it needs to go, it is easy to make mistakes. Calyptia Cloud can help you troubleshoot your pipeline configuration.
Paste the configuration below into the Calyptia Cloud configuration editor and hit Validate.
[SERVICE]
    Flush         1
    Log_File      /var/log/fluentbit.log
    Log_Level     error
    Daemon        off
    Parsers_File  parsers.conf
    HTTP_Server   On
    HTTP_Listen   0.0.0.0
    HTTP_Port     2020

[INPUT]
    Name              tail
    Tag               test.file
    Path              /var/log/apache2/error.log
    DB                /var/log/apache2_error.db
    Path_Key          filename
    Parser            apache2
    Mem_Buf_Limit     8MB
    Skip_Long_Lines   On
    Refresh_Interval  30

[INPUT]
    Name              tail
    Tag               kube.*
    Path              ${PATH}
    Parser            docker
    DB                /var/log/flb_kube.db
    Mem_Buf_Limit     7MB
    Skip_Long_Lines   On
    Refresh_Interval  10

[FILTER]
    Name    record_modifier
    Match   *
    Record  logtype nginx
    Record  hostname ${HOSTNAME}
    Record  service_name Sample-App-Name

[FILTER]
    Name    kubernetes
    Match   kube.*
    Kube_URL  https://kubernetes.default.eab.cluster.local:443
    Merge_JSON_Log Off

[OUTPUT]
    Name    nrlogs
    Match   *
    apiKey  ${API_KEY}
This time when we hit validate, we can see an error in our Kubernetes filter: “configuration option: merge_json_log not found for filter plugin: kubernetes.”
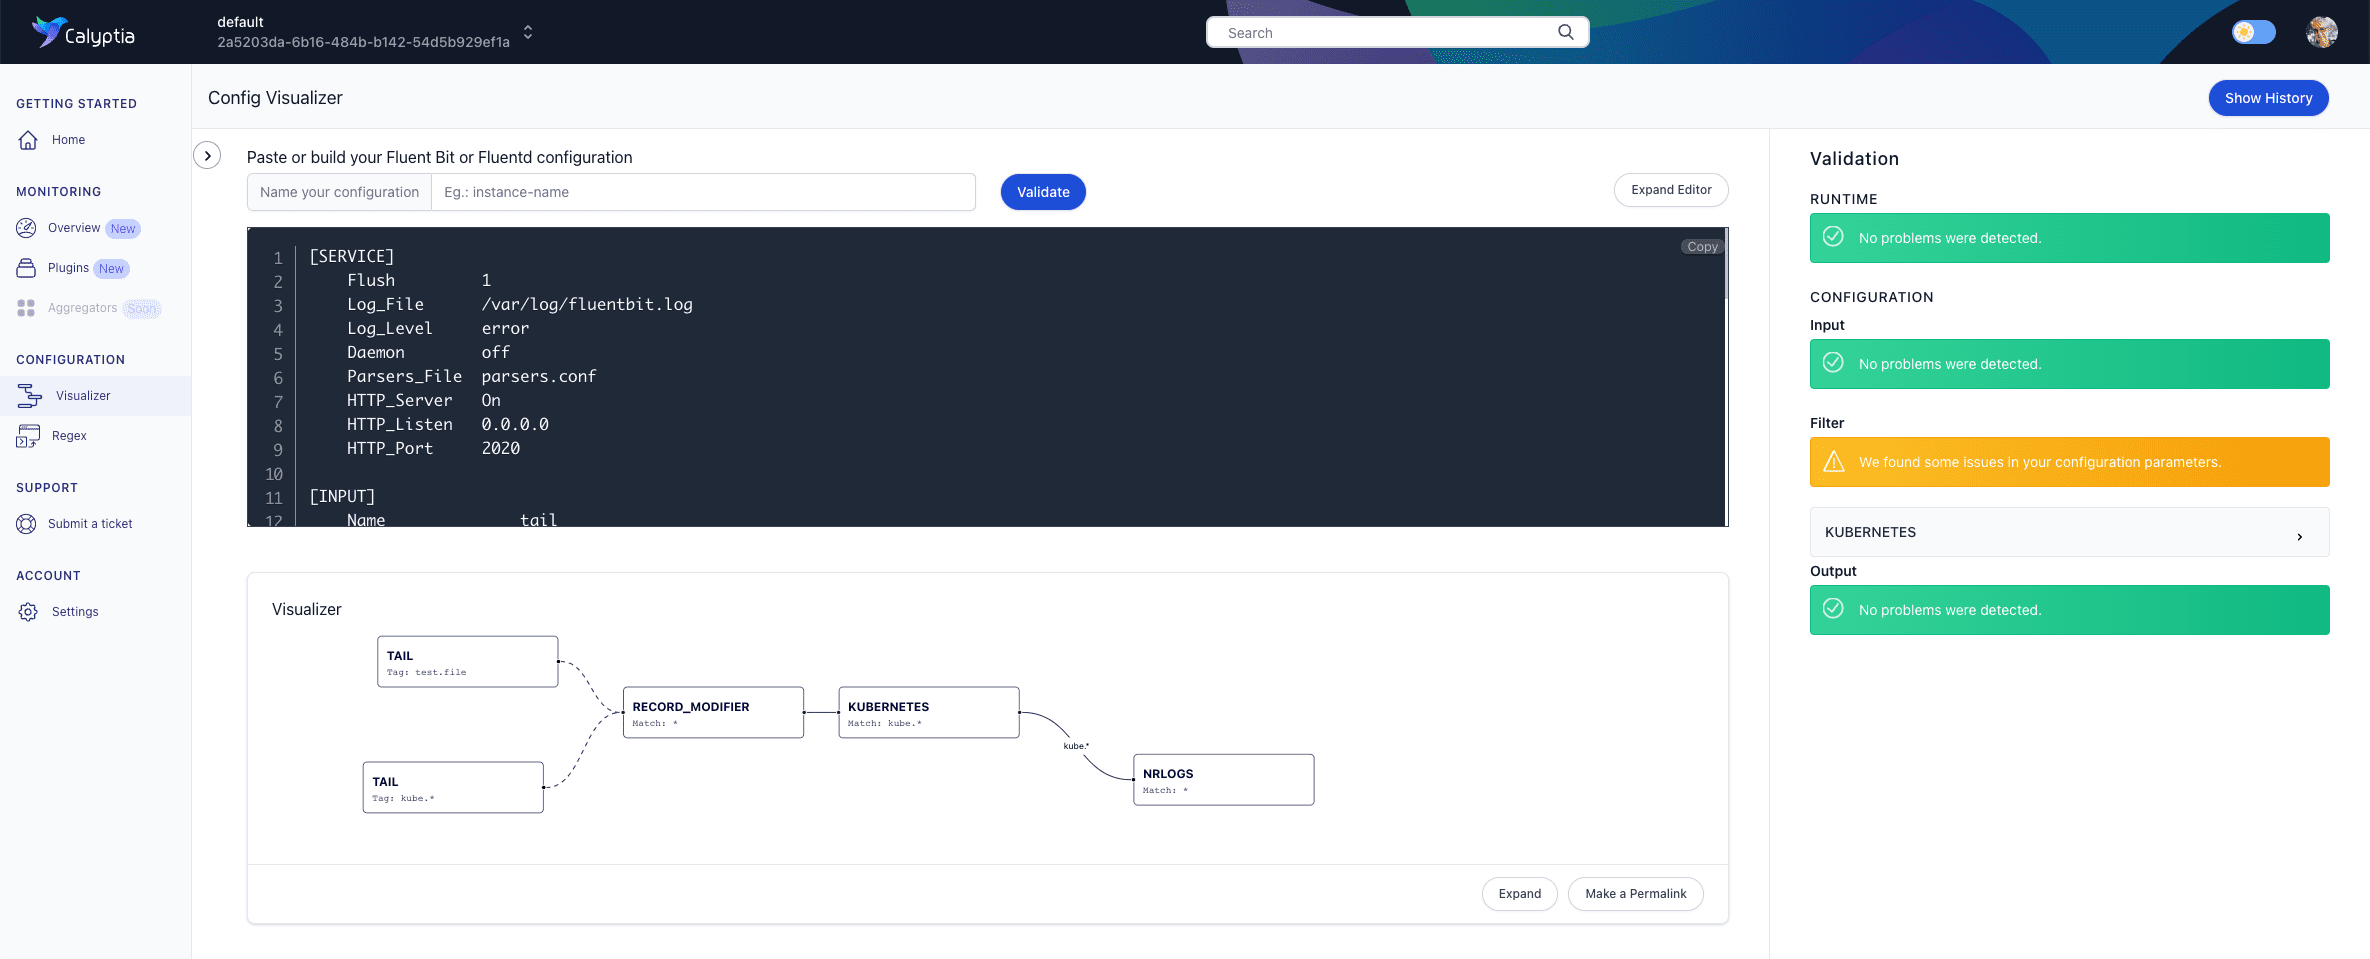
The error appears to be in this line:
Merge_JSON_Log OffAfter a quick review of the official Fluent Bit documentation for the Kubernetes filter, we discover that we have misused the key. It should be:
Merge_Log OffMake that change in the editor, and the error message should disappear.
Note: As we are using Fluent Bit configs in this tutorial. Merge_JSON_Log is the correct key phrasing for the Fluentd Kubernetes plugin. If we were testing Fluentd configuration files that line would have passed, although others would have failed because of differences between the two projects.
Another Troubleshooting Example
Let’s try one final example that reveals a different way to diagnose an issue. To follow along, copy, paste, and validate this sample:
[INPUT]
    Name    tail
    Tag     task-status-es
    Path    /var/log/containers/htc-agent-erik*.log
    Parser  docker
    DB      /var/fluent-bit/state/flb_container.db
    DB.locking  true
    Mem_Buf_Limit 50MB
    Skip_Long_Lines  On
    Skip_Empty_Lines On
    Refresh_Interval 10
    Rotate_Wait      30
    storage.type     filesystem
    Read_from_Head   True
[FILTER]
    name    grep
    match   task-status-es
    regex   $log['node'] update_status
[FILTER]
    Name    nest
    Match   task-status-es
    Operation  lift
    Nested_under  log
    Remove_prefix  log
[FILTER]
    Name    nest
    Match   task-status-es
    Operation  lift
    Nested_under  message
    Remove_prefix  message
[FILTER]
    Name    record_modifier
    Match   task-status-es
    Remove_key node
    Remove_key level
    Remove_key stream
    Remove_key time
[OUTPUT]
    Name    es
    Match   task-status-es
    AWS_Region  us-east-1
    AWS_Auth  On
    tls     On
    Host    vpc-grid-monitoring-4qvdh2mbu4qvdhzuceuh2cke.us-east-1.es.amazonaws.com
    Port    443
    Logstash_Format  On
    Logstash_DateFormat  %Y%m%d
    Logstash_Prefix  grid-tasks
    Trace_Error  On
    Trace_Output  Off
    Id_Key  $task_id
    Write_Operation  upsert
    Retry_Limit  10
[OUTPUT]
    Name    cloudwatch_logs
    Match   task-status-se
    region  us-east-1
    log_key log
    log_group_name  /aws/containers/ebledsoe/application
    log_stream_prefix  ${HOST_NAME}-
    auto_create_group  true
    log_retention_days 1
    extra_user_agent    container-insights
    Retry_Limit  False
The file didn’t trigger any warnings, indicating that it is formatted correctly.
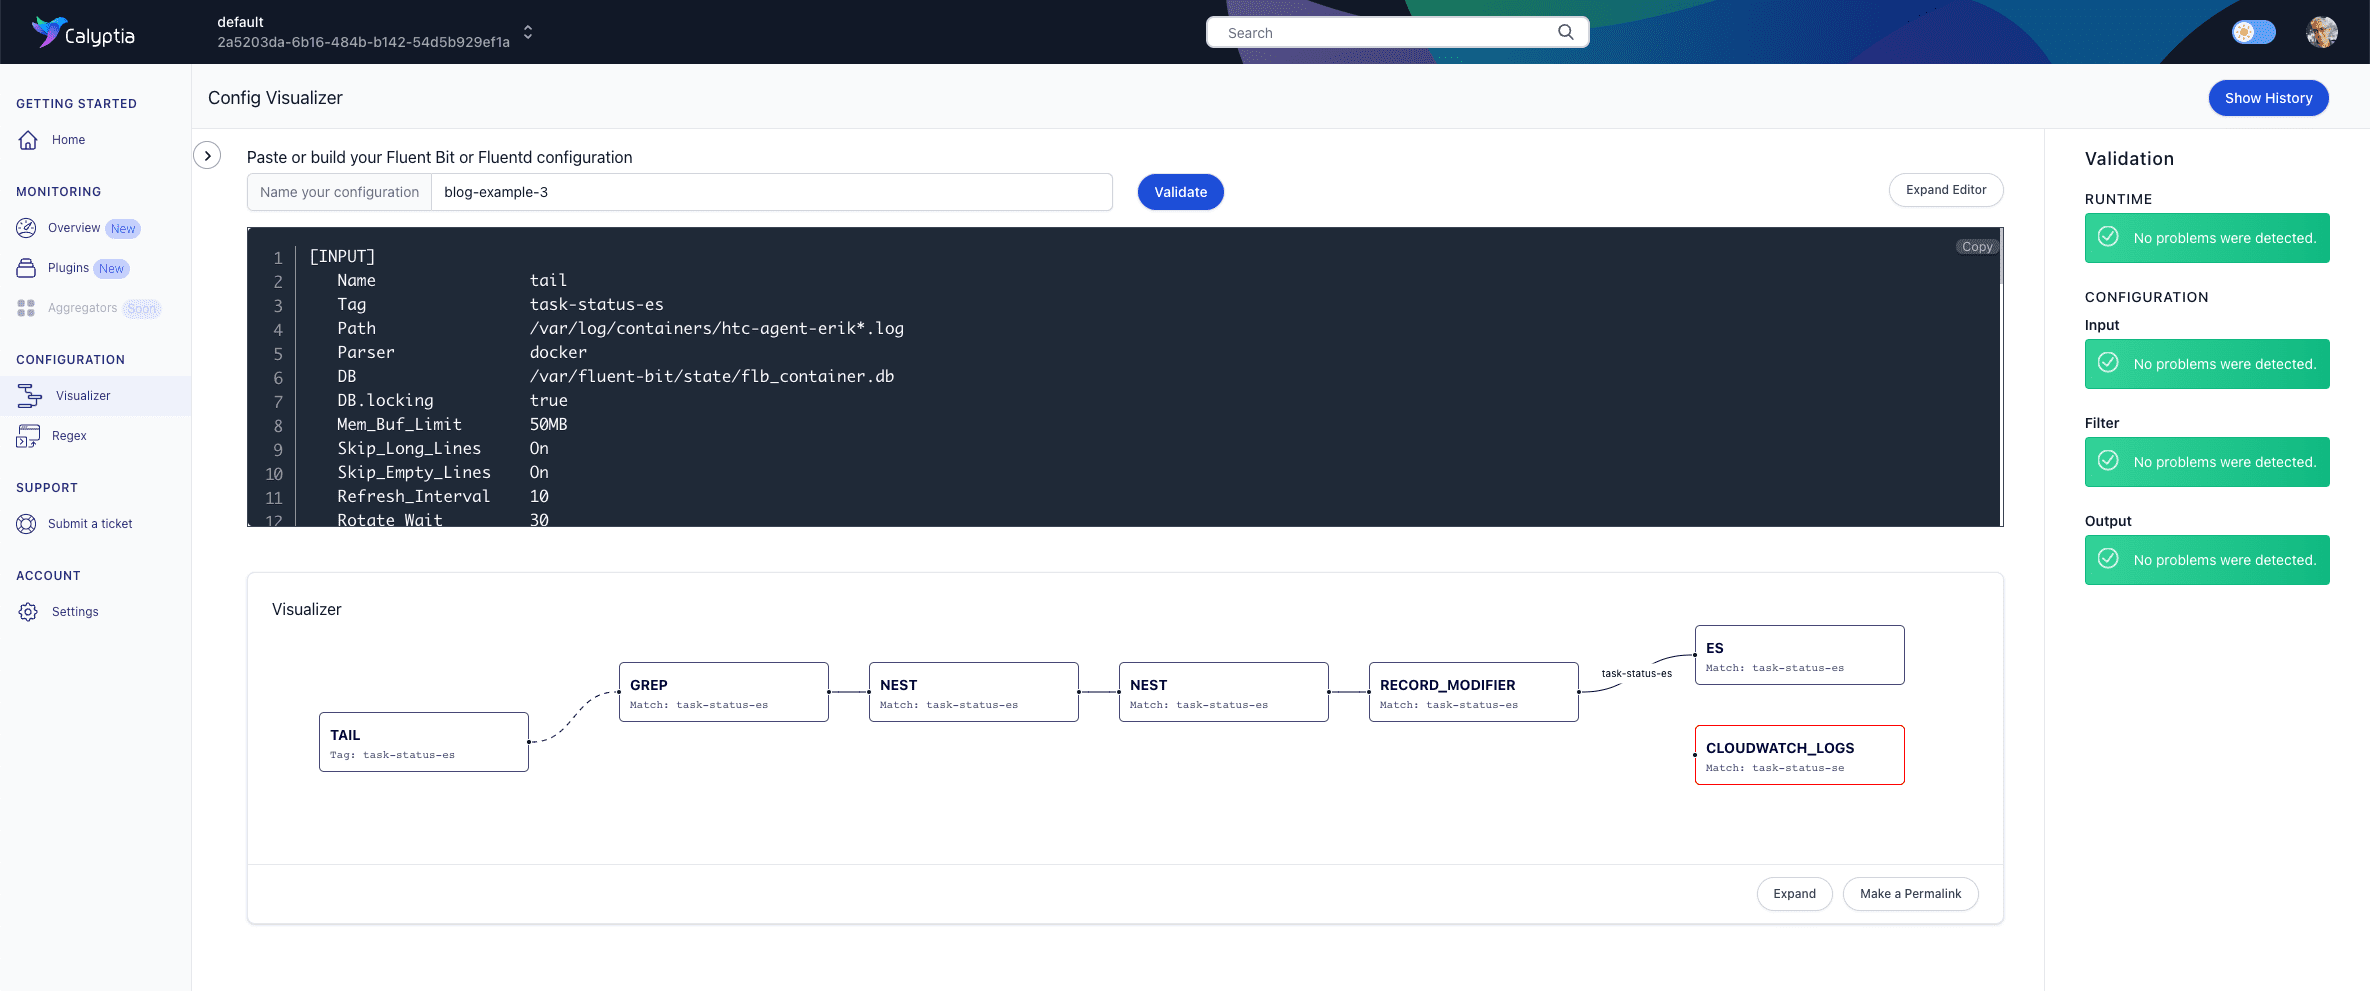
However, if you look at the visualization of our pipeline, you’ll notice that one of our outputs, cloudwatch_logs, is not connected, and its orphaned status is indicated by its red border.
Since we know that in this case, we were simply trying to deliver the same data to two separate outputs, the problem is probably in the Match key/value pair. A quick review of the line reveals a typo in the value. Reverse the final two letters (se >> es), and the file should now be fine.
Limitations
Calyptia Cloud won’t catch every error you may make. It won’t, for example, know that you’ve mistyped the IP address of your host. But we hope that you find it a useful tool.
Next Steps
If you haven’t already, sign up for your free Calyptia Cloud account. In the coming weeks, we’ll be posting more tutorials, including one on using Calyptia Cloud to monitor your running Fluent Bit instances.
You may also want to check out Calyptia’s full range of Fluent Bit-based services and products for the enterprise, including:
Calyptia Core — a Kubernetes solution that simplifies data collection, aggregation, and routing at scale
Calyptia for Fluent Bit — a Long Term Support edition of Fluent Bit for enterprises that require predictable upgrades and an SLA
Calyptia Cloud — a hosted solution for validating, visualizing, and optimizing your Fluentd and Fluent Bit-based observability pipelines
About Calyptia
Named a Cool Vendor in Observability and Monitoring for Logging and Containers by Gartner® for 2022, Calyptia is a leader in solutions for enterprise observability and the creator and primary maintainer of the Fluent Bit open source project. With over a billion deployments, Fluent Bit is the industry-standard open-source engine for enterprise observability of logs and metrics, and it is included in major Kubernetes distributions, including Google Kubernetes Engine (GKE), AWS Elastic Kubernetes Service (EKS), and Azure Kubernetes Service (AKS).
You might also like
Fluent Bit and Fluentd – a child or a successor?
Fluent Bit may have started as a sibling to Fluentd, but it is fair to say that it has now grown up and is Fluentd's equal. Learn which is right for your needs and how they can be used together.