
How to send OpenShift logs and metrics to Datadog, Elastic and Grafana – all at the same time!
How to send OpenShift logs and metrics to Datadog, Elastic and Grafana – all at the same time!
Metrics and logging from OpenShift via Fluent Bit to any platform
Introduction
This guide covers how to deploy fully functional instances of Calyptia Fluent Bit and support forwarding the observability information (logs and metrics) of your cluster to various destinations including Datadog, Grafana Cloud, Elastic Cloud and others.
One of the primary benefits to using Fluent Bit for this use case is that it enables you to target multiple outputs and easily change between them without having to run a dedicated operator or deployment for each: You can use the same instance of Fluent Bit to send your data to Grafana and Elastic for example, or migrate data from one to the other and verify.
The key aspects to cover for any deployment are:
Access to host metrics. (Optional)
Configuration of the Fluent Bit output plugin (or plugins) of your choice.
Everything in this guide is also available in a Git repository here: https://github.com/calyptia/openshift-fluent-bit-examples
OpenShift constraints
Before we get started, we should address some of the additional security constraints in the OpenShift environment. OpenShift has some additional features to help secure the platform, one of these is the security context constraints which are essentially security profiles for your pods. By default this will prevent direct access to the host as this can open up various exploits. Unfortunately Fluent Bit needs some access to the host: namely the log files from the container runtime to read and forward on to your specific observability platform, there are some small extra setup steps required.
There is a good overview of how security context constraints should be used here: https://cloud.redhat.com/blog/managing-sccs-in-openshift
The official documentation for Fluent Bit also provides some of the details here but we will walk through it in detail to explain what is required and why. A full example is also provided in the Git repository with basic automation.
Code-ready containers
For the purpose of this article we use the Red Hat Code-ready Containers tool which is a local instance of OpenShift running in a VM: https://developers.redhat.com/products/codeready-containers/overview
(4.10.3 version used for this article)
This instance is not intended for production and obviously is resource limited to your local hardware however the configuration here should also function on a full production OpenShift 4 cluster. One area I found limiting, particularly with Elastic, was the network I/O which meant the clusters eventually backed up sending their logs out. When running in a production environment this should not be an issue as long as you have allocated enough resources.
In production, there may be some additional requirements for ingress and egress of data, network policies or other constraints specific to your infrastructure and its setup. To keep things simple for this post we ignore those.
Initial test
Initially we want to verify that the Code Ready Containers (CRC) is set up and it can pull our image to run with a default configuration that requires no extra security configuration. By default Fluent Bit runs with a configuration that just accesses local CPU information and outputs it to standard output.
Set up CRC according to the Red Hat documentation for your platform.
Deploy a Fluent Bit Kubernetes Daemonset to test the image runs – just create and specify the image as registry.connect.redhat.com/calyptia/fluent-bit to confirm we can pull and run this image.
Verify the pods are all running in the OpenShift console or with oc/kubectl and check their logs show some CPU information rather than any errors.
Now we know our image is pulled and run correctly so the next step is to specify a custom configuration. This confirms we are picking up this configuration and also exposes the Fluent Bit metrics via a Prometheus endpoint.
Set up a Kubernetes ConfigMap for this configuration: configmap-fluent-bit-config.yaml
Update the previous Kubernetes Daemonset (or create a new one) to use the configuration: daemonset-fluent-bit.yaml
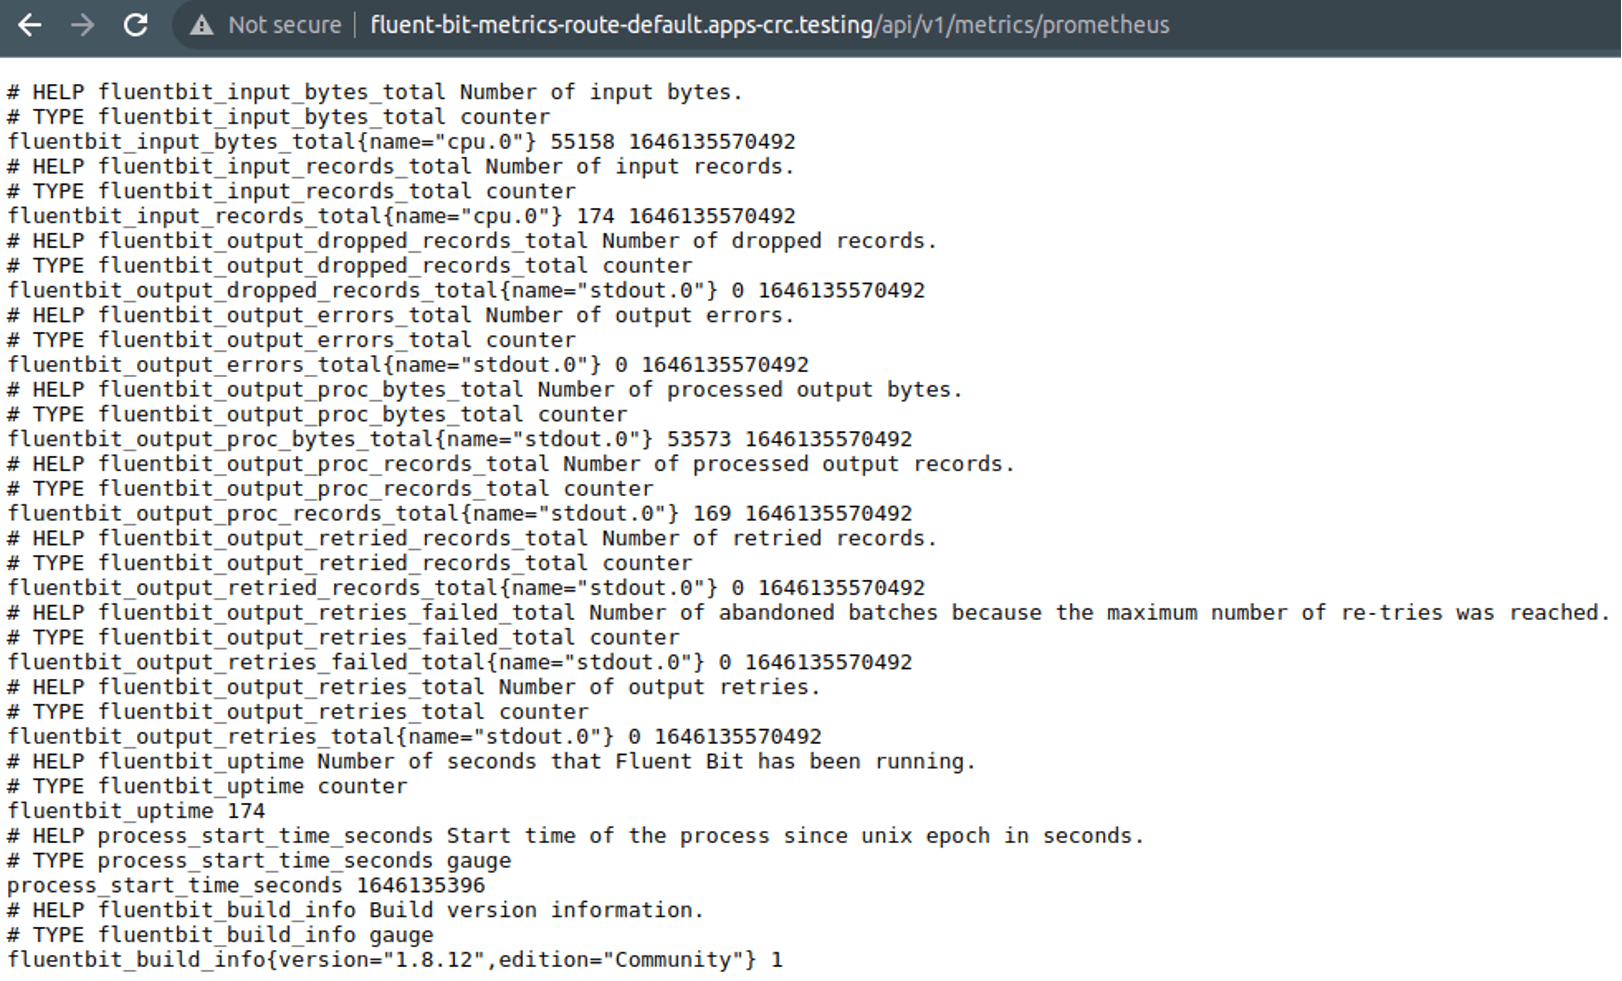
Set up a service and a route to see Fluent Bit metrics directly
a. Service: service-fluent-bit-metrics.yaml
b. Route: route-fluent-bit-metrics-route.yaml
Now if we browse to the appropriate URL (generated by CRC so check yours):
http://fluent-bit-metrics-route-default.apps-crc.testing/api/v1/metrics/prometheus
Gather logs
The example above only uses the CPU input plugin to make things simple – to access logs for all the containers in the pods we need extra security configuration and other settings to allow it. Let us now change the configuration so we can read the container logs.
Make sure to restart Fluent Bit pods on any configuration change.
We start with the official Fluent Bit Helm chart deployment as a test case: https://github.com/fluent/helm-charts/tree/main/charts/fluent-bit
Make sure to delete the original Kubernetes Daemonset first then install the Helm chart with defaults:
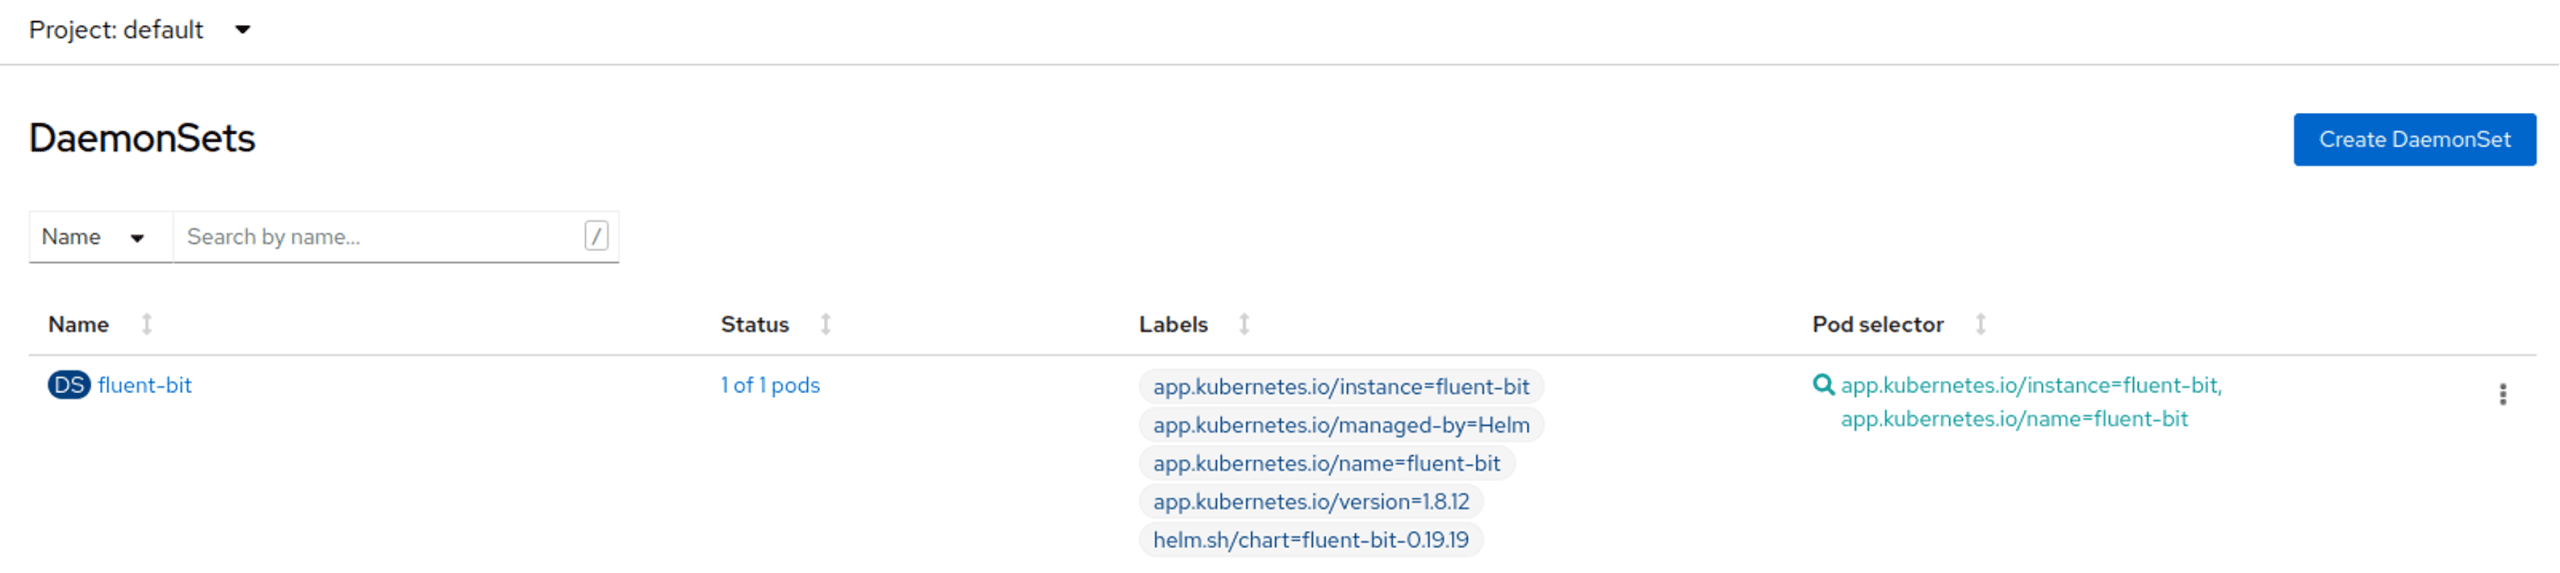
$ helm upgrade --install fluent-bit fluent/fluent-bitThis should give you a new Kubernetes Daemonset with the same name but different labels as it is now managed by Helm:
Security configuration to access logs
If you look at the logs for the pods involved, you will see it is failing to read the logs as it is missing the relevant security configuration:
[1mFluent Bit v1.8.12[0m
* [1m[93mCopyright (C) 2019-2021 The Fluent Bit Authors[0m
* [1m[93mCopyright (C) 2015-2018 Treasure Data[0m
* Fluent Bit is a CNCF sub-project under the umbrella of Fluentd
* https://fluentbit.io

[2022/03/01 12:58:01] [ info] [engine] started (pid=1)
[2022/03/01 12:58:01] [ info] [storage] version=1.1.5, initializing...
[2022/03/01 12:58:01] [ info] [storage] in-memory
[2022/03/01 12:58:01] [ info] [storage] normal synchronization mode, checksum disabled, max_chunks_up=128
[2022/03/01 12:58:01] [ info] [cmetrics] version=0.2.2
[2022/03/01 12:58:01] [ info] [input:tail:tail.0] multiline core started
[2022/03/01 12:58:01] [error] [input:tail:tail.0] read error, check permissions: /var/log/containers/*.log
[2022/03/01 12:58:01] [ warn] [input:tail:tail.0] error scanning path: /var/log/containers/*.log
[2022/03/01 12:58:01] [ info] [filter:kubernetes:kubernetes.0] https=1 host=kubernetes.default.svc port=443
[2022/03/01 12:58:01] [ info] [filter:kubernetes:kubernetes.0] local POD info OK
[2022/03/01 12:58:01] [ info] [filter:kubernetes:kubernetes.0] testing connectivity with API server...
[2022/03/01 12:58:01] [ info] [filter:kubernetes:kubernetes.0] connectivity OK
[2022/03/01 12:58:01] [ info] [http_server] listen iface=0.0.0.0 tcp_port=2020
[2022/03/01 12:58:01] [ info] [sp] stream processor started
Let us resolve this now. The simplest thing to do is just make a privileged pod. This is “sub optimal” but you can see an example of such a pod spec: pod-fluent-bit-7m2kq.yaml
To use the Fluent Bit Kubernetes filter we also need a service account with RBAC permissions to allow it. We should combine the two requirements into a single role that allows us all the permissions we require (and no more!).
If we look at the OpenShift log collector stack we can see these things:
A logcollector service account is used: serviceaccount-logcollector.yaml
This has a role-binding to the log-collector-privileged role: rolebinding-log-collector-privileged-binding.yaml
The log-collector-privileged role sets up the usage of the log-collector-scc security context constraint (SCC): role-log-collector-privileged.yaml
The SCC then handles the “magic”!
securitycontextconstraints-log-collector-scc.yaml
allowHostPorts: false
priority: null
requiredDropCapabilities:
  - CHOWN
  - DAC_OVERRIDE
  - FSETID
  - FOWNER
  - SETGID
  - SETUID
  - SETPCAP
  - NET_BIND_SERVICE
  - KILL
allowPrivilegedContainer: false
runAsUser:
  type: RunAsAny
users: []
allowHostDirVolumePlugin: true
allowHostIPC: false
forbiddenSysctls:
  - '*'
seLinuxContext:
  type: RunAsAny
readOnlyRootFilesystem: true
metadata:
  name: log-collector-scc
fsGroup:
  type: RunAsAny
groups: []
kind: SecurityContextConstraints
defaultAddCapabilities: null
supplementalGroups:
  type: RunAsAny
volumes:
  - configMap
  - emptyDir
  - hostPath
  - secret
allowHostPID: false
allowHostNetwork: false
allowPrivilegeEscalation: false
apiVersion: security.openshift.io/v1
allowedCapabilities: null
defaultAllowPrivilegeEscalation: false
We can therefore repeat this ourselves – we could just reuse the above but it requires installing the cluster logging operator first to create it so we will duplicate it ourselves. It is also best practice to keep our configuration separate plus makes it simpler to manage as we update.
First of all, let’s create a dedicated namespace – or project in Red Hat terminology – for our components.
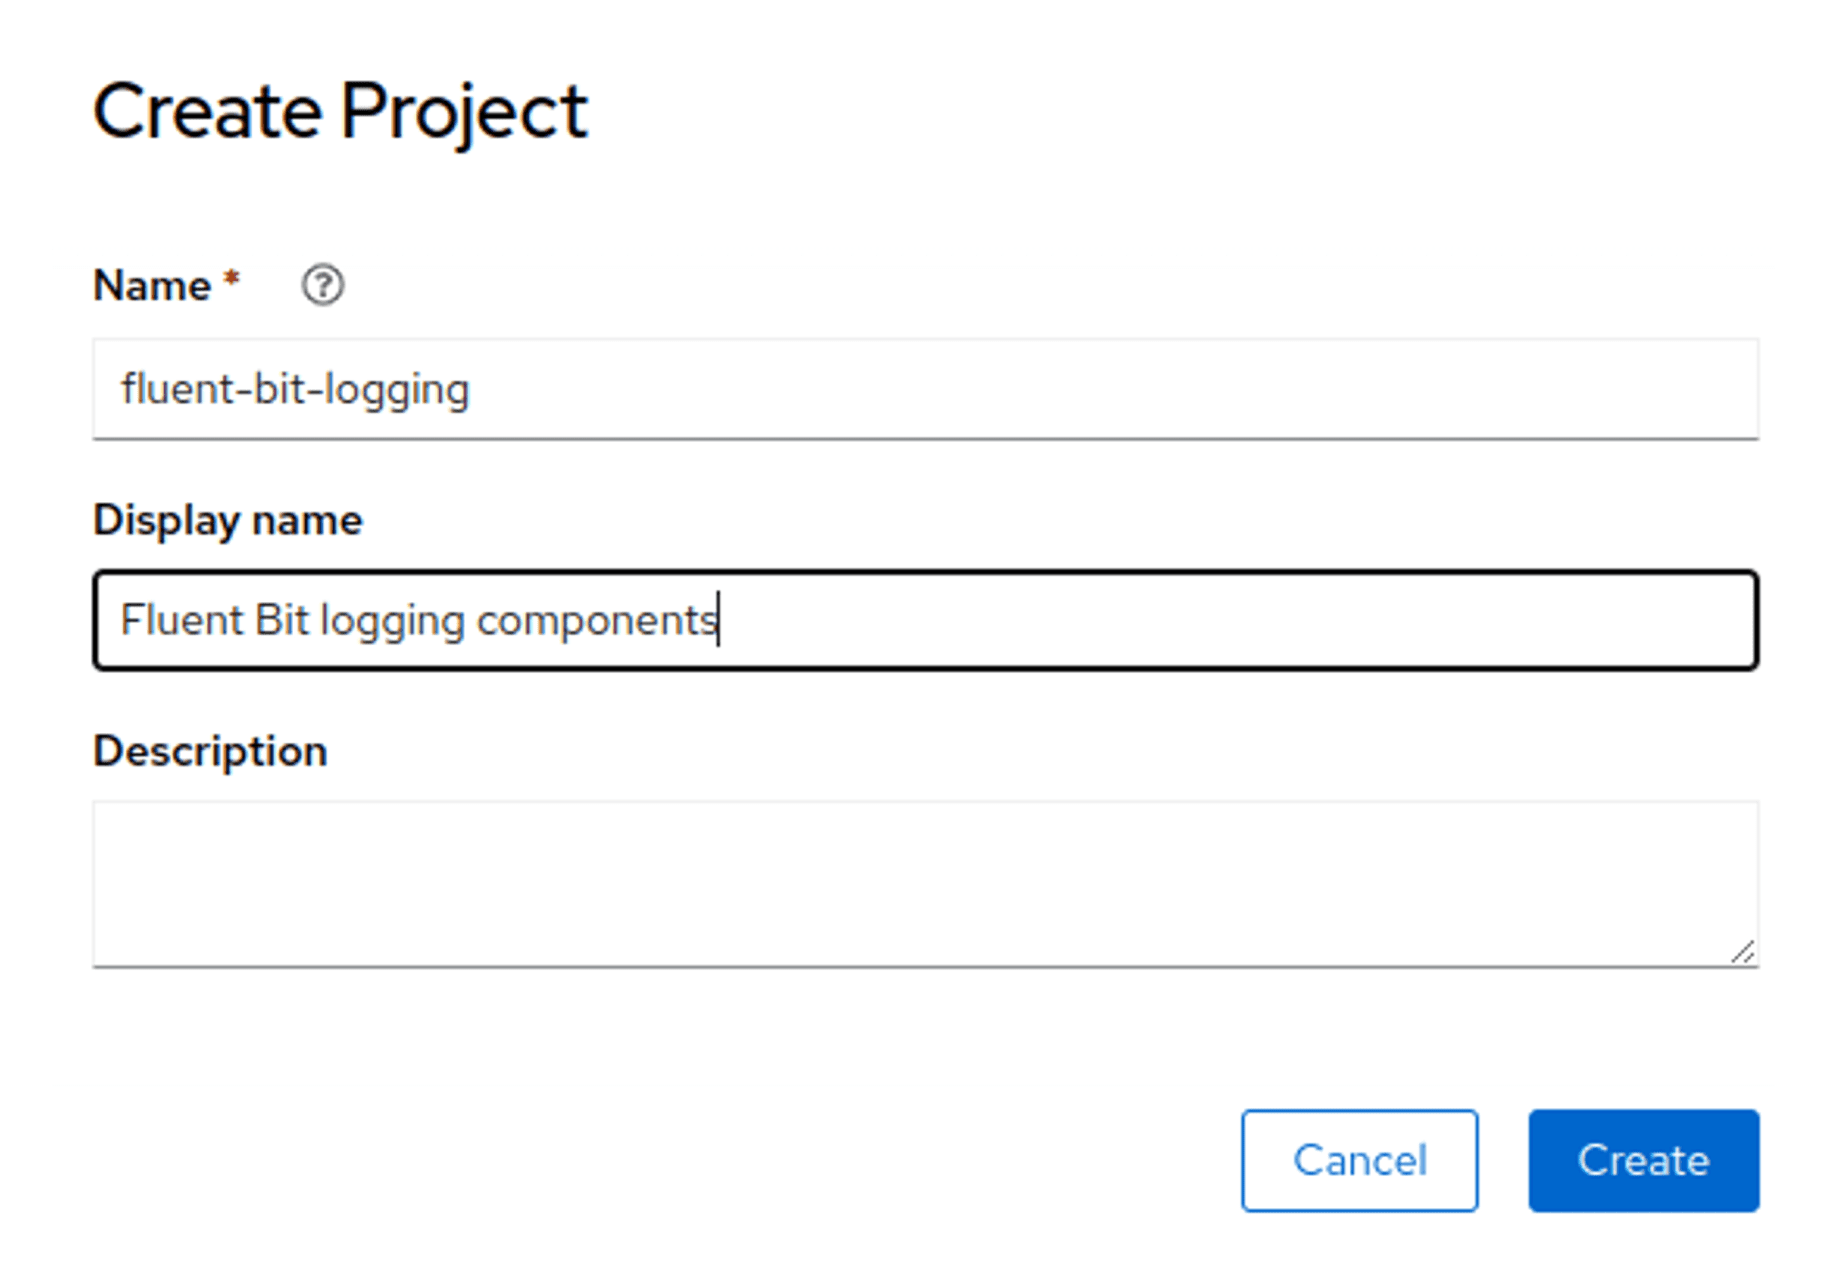
Working configuration
Create a service account that binds to the SCC as the OpenShift components did. The easiest way to do this is with a YAML file containing the various components but you can also do it via the web UI for each individual component:
kind: Namespace
apiVersion: v1
metadata:
name: fluent-bit-logging
---
apiVersion: v1
kind: ServiceAccount
metadata:
name: fluent-bit
namespace: fluent-bit-logging
---
apiVersion: security.openshift.io/v1
kind: SecurityContextConstraints
metadata:
name: fluent-bit-scc
allowHostPorts: false
priority: null
requiredDropCapabilities:
- CHOWN
- DAC_OVERRIDE
- FSETID
- FOWNER
- SETGID
- SETUID
- SETPCAP
- NET_BIND_SERVICE
- KILL
allowPrivilegedContainer: false
runAsUser:
type: RunAsAny
users: []
allowHostDirVolumePlugin: true
allowHostIPC: false
forbiddenSysctls:
- '*'
seLinuxContext:
type: RunAsAny
readOnlyRootFilesystem: true
fsGroup:
type: RunAsAny
groups: []
defaultAddCapabilities: null
supplementalGroups:
type: RunAsAny
volumes:
- configMap
- emptyDir
- hostPath
- secret
allowHostPID: false
allowHostNetwork: false
allowPrivilegeEscalation: false
allowedCapabilities: null
defaultAllowPrivilegeEscalation: false
---
apiVersion: rbac.authorization.k8s.io/v1
kind: Role
metadata:
name: fluent-bit-role
namespace: fluent-bit-logging
rules:
- verbs:
- use
apiGroups:
- security.openshift.io
resources:
- securitycontextconstraints
resourceNames:
- fluent-bit-scc
---
kind: RoleBinding
apiVersion: rbac.authorization.k8s.io/v1
metadata:
name: fluent-bit-role-binding
namespace: fluent-bit-logging
subjects:
- kind: ServiceAccount
name: fluent-bit
namespace: fluent-bit-logging
roleRef:
apiGroup: rbac.authorization.k8s.io
kind: Role
name: fluent-bit-role
Now that we have it all we can set up a Kubernetes Daemonset to use everything and mount the logs into it. You may want to filter the logs being tailing as doing all of them really hurt my poor little laptop!
apiVersion: v1
kind: ConfigMap
metadata:
  name: fluent-bit-config
  namespace: fluent-bit-logging
data:
  fluent-bit.conf: |-
    [SERVICE]
        Daemon Off
        Log_Level Info
        HTTP_Server On
        HTTP_Listen 0.0.0.0
        HTTP_Port 2020
        Health_Check On
        Parsers_File parsers.conf

    [INPUT]
        Name tail
        Path /var/log/containers/*.log
        multiline.parser docker, cri
        Tag kube.*
        Mem_Buf_Limit 5MB
        Skip_Long_Lines On

    [INPUT]
        Name systemd
        Tag host.*
        Systemd_Filter _SYSTEMD_UNIT=kubelet.service
        Read_From_Tail On

    [FILTER]
        Name kubernetes
        Match kube.*
        Merge_Log On
        Keep_Log Off
        K8S-Logging.Parser On
        K8S-Logging.Exclude On

    [OUTPUT]
        Name stdout
        Match *
---
apiVersion: apps/v1
kind: DaemonSet
metadata:
  name: fluent-bit
  namespace: fluent-bit-logging
spec:
  selector:
    matchLabels:
      app: fluent-bit
  template:
    metadata:
      labels:
        app: fluent-bit
    spec:
      serviceAccountName: fluent-bit
      containers:
        - name: fluent-bit
          image: 'registry.connect.redhat.com/calyptia/fluent-bit:1.9.0'
          securityContext:
            runAsUser: 0
            seLinuxOptions:
              type: spc_t
            readOnlyRootFilesystem: true
            allowPrivilegeEscalation: false
          ports:
            - containerPort: 2020
          volumeMounts:
            - name: config-volume
              mountPath: /fluent-bit/etc/fluent-bit.conf
              subPath: fluent-bit.conf
            - name: varlogcontainers
              readOnly: true
              mountPath: /var/log/containers
            - name: varlogpods
              readOnly: true
              mountPath: /var/log/pods
      volumes:
        - name: config-volume
          configMap:
            name: fluent-bit-config
        - name: varlogcontainers
          hostPath:
            path: /var/log/containers
        - name: varlogpods
          hostPath:
            path: /var/log/pods
We have to mount /var/logs/pods because this is where the actual logs under /var/logs/containers are symlinked to. If it is not mounted then the link fails to resolve.
Helm chart configuration
We can also tell the helm chart to use this service account and ensure the extra volumes are mounted. This is covered in the examples here: https://github.com/calyptia/openshift-fluent-bit-examples/tree/main/cluster-log-access
For the Helm chart you need to first create the service account and relevant bindings to the SCC as per the YAML above: https://github.com/calyptia/openshift-fluent-bit-examples/blob/main/cluster-log-access/service-account-creation.sh
After that we can just tell it to use the service account instead of creating one with some overrides: https://github.com/calyptia/openshift-fluent-bit-examples/blob/main/cluster-log-access/values.yaml
serviceAccount:
  create: false
  name: fluent-bit

securityContext:
  runAsUser: 0
  seLinuxOptions:
    type: spc_t
  readOnlyRootFilesystem: true
  allowPrivilegeEscalation: false
Grafana Cloud integration
This section covers how to set this up for Grafana Cloud with an added bonus of also demonstrating using Fluent Bit to also provide metrics. It means you only need one agent (and one configuration) to provide both logs and metrics.
Everything is available in a Git repository here: https://github.com/calyptia/openshift-fluent-bit-examples/tree/main/grafana-cloud
This includes a simple script to deploy with Helm plus the supporting Helm values file for this as a template you can substitute your particular configuration into easily.
Logs to Loki
Local
As OpenShift is moving to Loki for its cluster logging stack, we can also run a local Loki instance very easily to test we can send it logs. This is a useful thing to do if you’re seeing issues sending to Grafana Cloud so you can rule out networking issues: you could also have a local instance to catch more logs (e.g. over a smaller time period for debugging or with sensitive information) with a smaller subset going to Grafana Cloud to persist or search outside the cluster.
Calyptia Fluent Bit can support multiple outputs of either the same or different types so this is trivial to do.
For our purposes, we just want a non-production Loki instance to use as easily as possible. We can use the Loki Stack Helm chart to deploy in single-process mode: https://grafana.com/docs/loki/latest/installation/helm/
If you want to run this in production make sure to read up on the relevant configuration you will need.
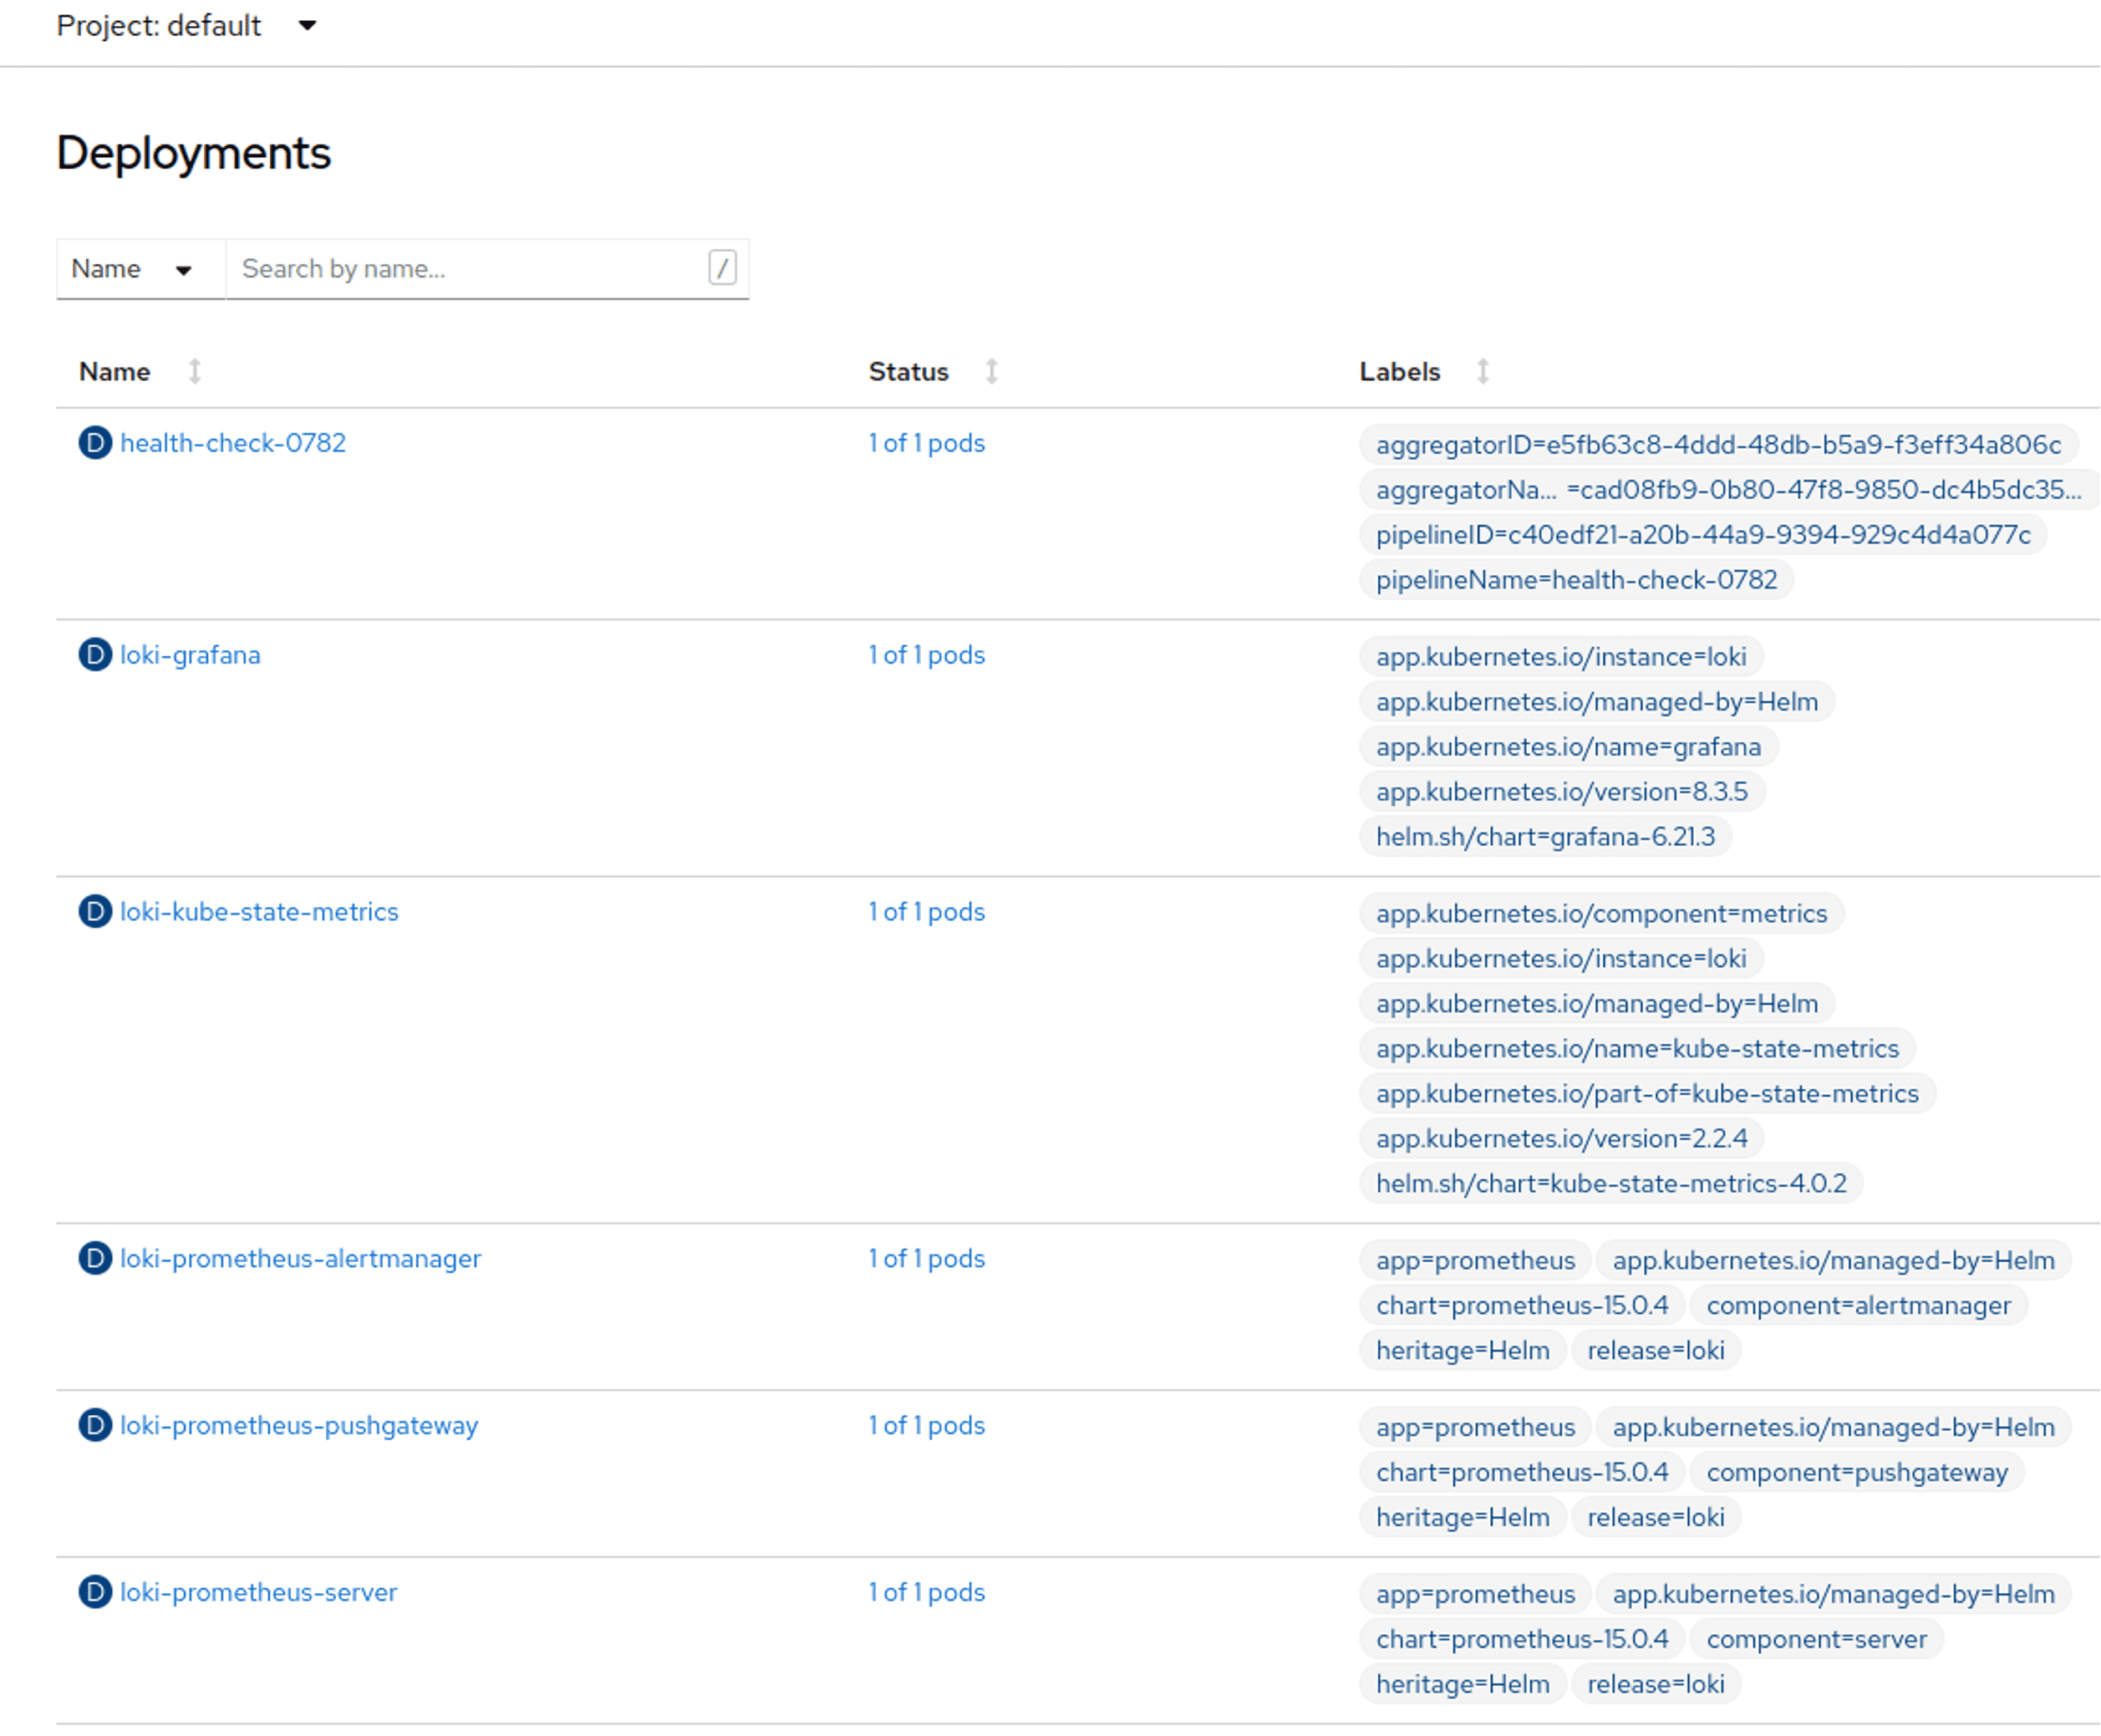
$ helm upgrade --install loki grafana/loki-stack --set grafana.enabled=true,prometheus.enabled=true,prometheus.alertmanager.persistentVolume.enabled=false,prometheus.server.persistentVolume.enabled=false,fluent-bit.enabled=false,promtail.enabled=falseThis installs the Loki, Grafana and Prometheus components locally. There are other options on OpenShift, e.g. the operator, but this is simple and consistent across K8S as well.
It actually installs other things like the Kube-state-metrics and Prometheus Node exporter charts too. We can disable those as well if we want but they’re useful to have for evaluation and test to compare against later.
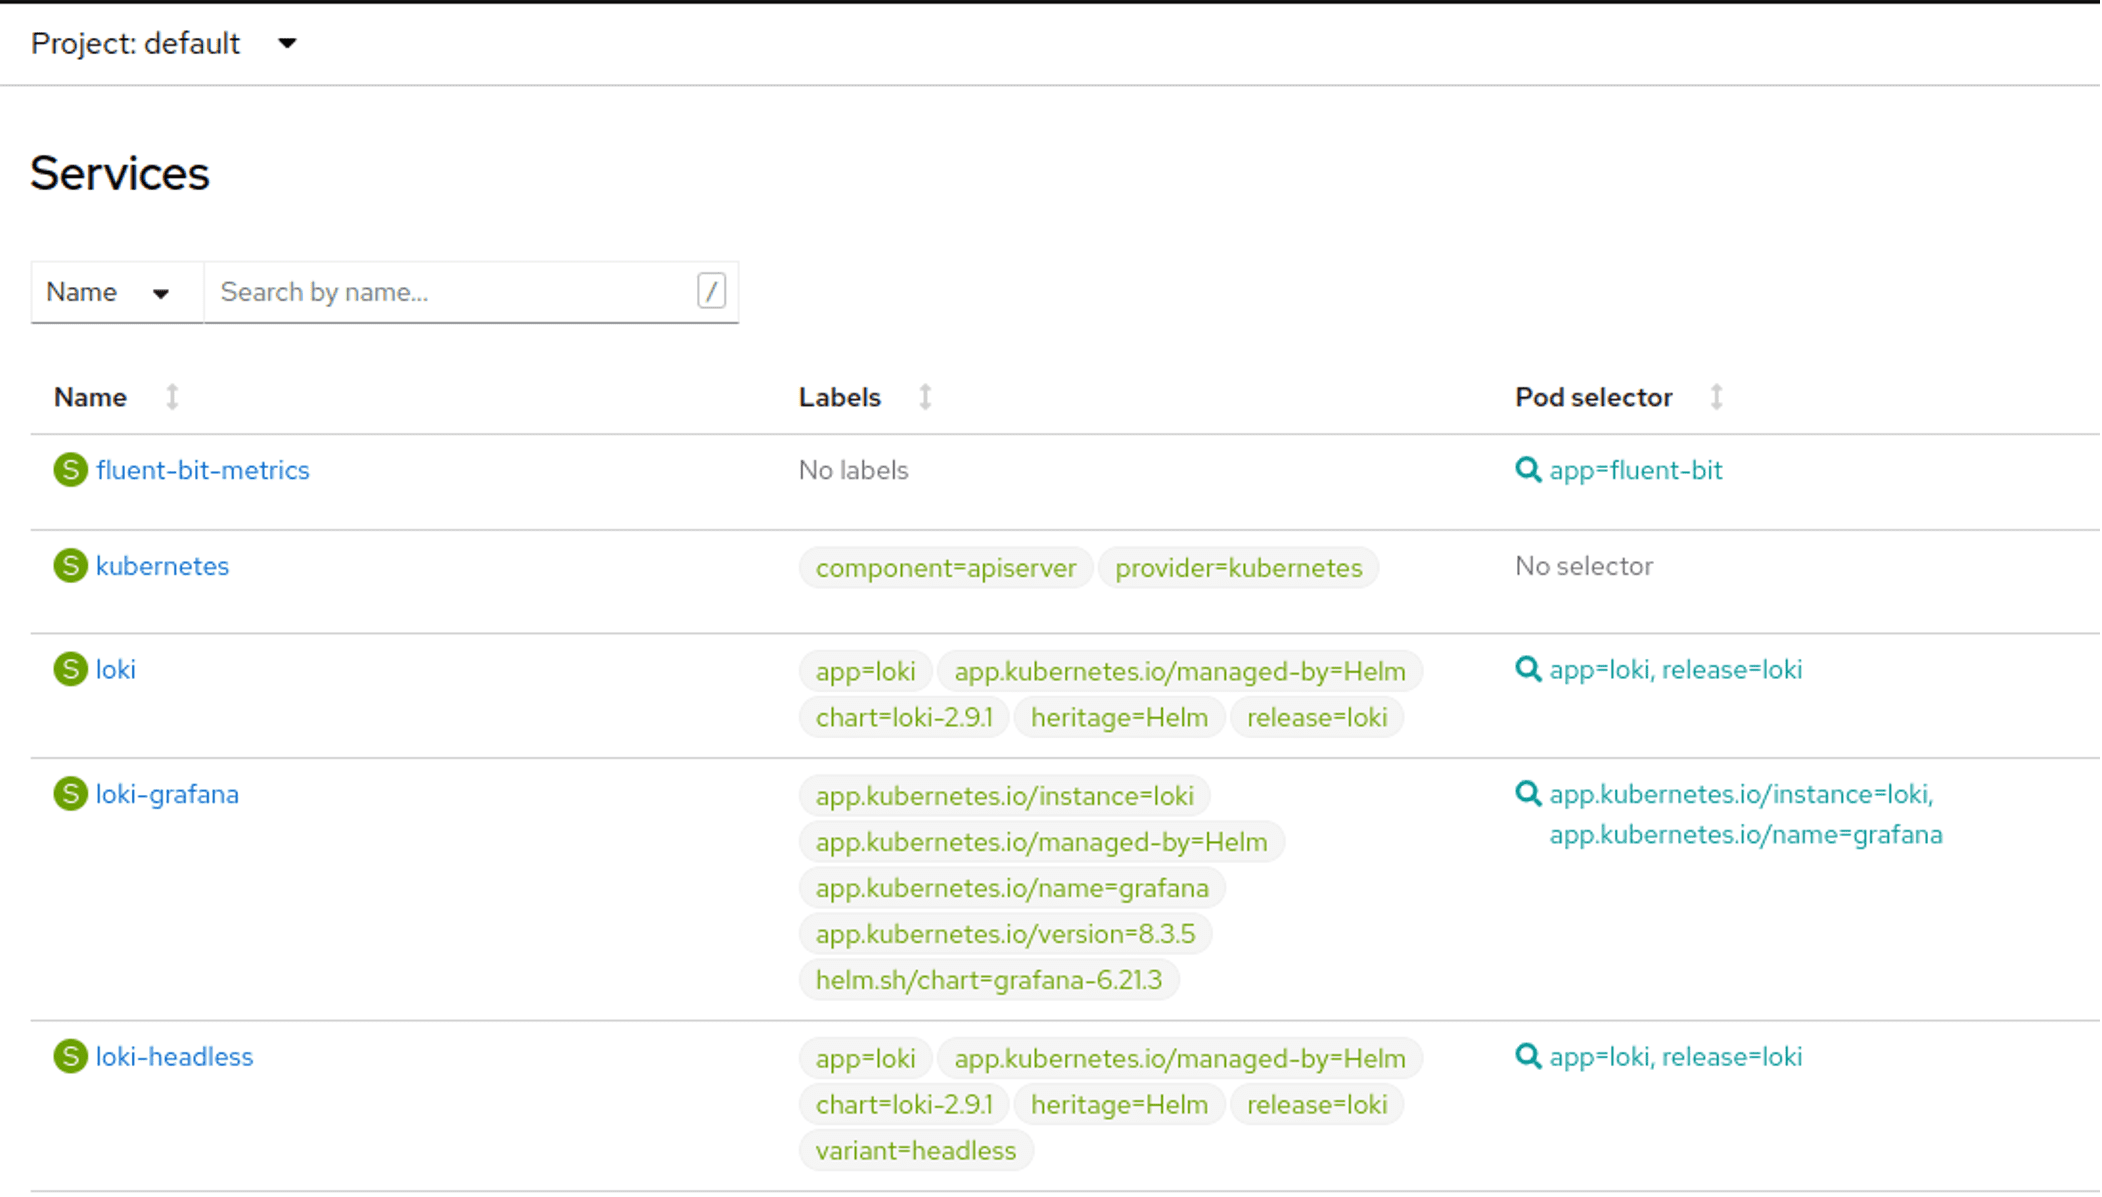
Create a Grafana route to the loki-grafana Kubernetes Service to access the UI directly: https://drive.google.com/file/d/1-yIbhMICNZ_on39mFZ6hYCnjV9C7Onzl/view?usp=sharing
We should now be able to log into Grafana to see metrics and logs (my URL in CRC, yours may be different): http://grafana-route-default.apps-crc.testing/login
The login information can be retrieved using the instructions from Grafana: https://grafana.com/docs/loki/latest/installation/helm/#deploy-grafana-to-your-cluster
$ kubectl get secret --namespace default loki-grafana -o jsonpath="{.data.admin-password}" | base64 --decode ; echoIt should all be automatically set up as an integrated stack:
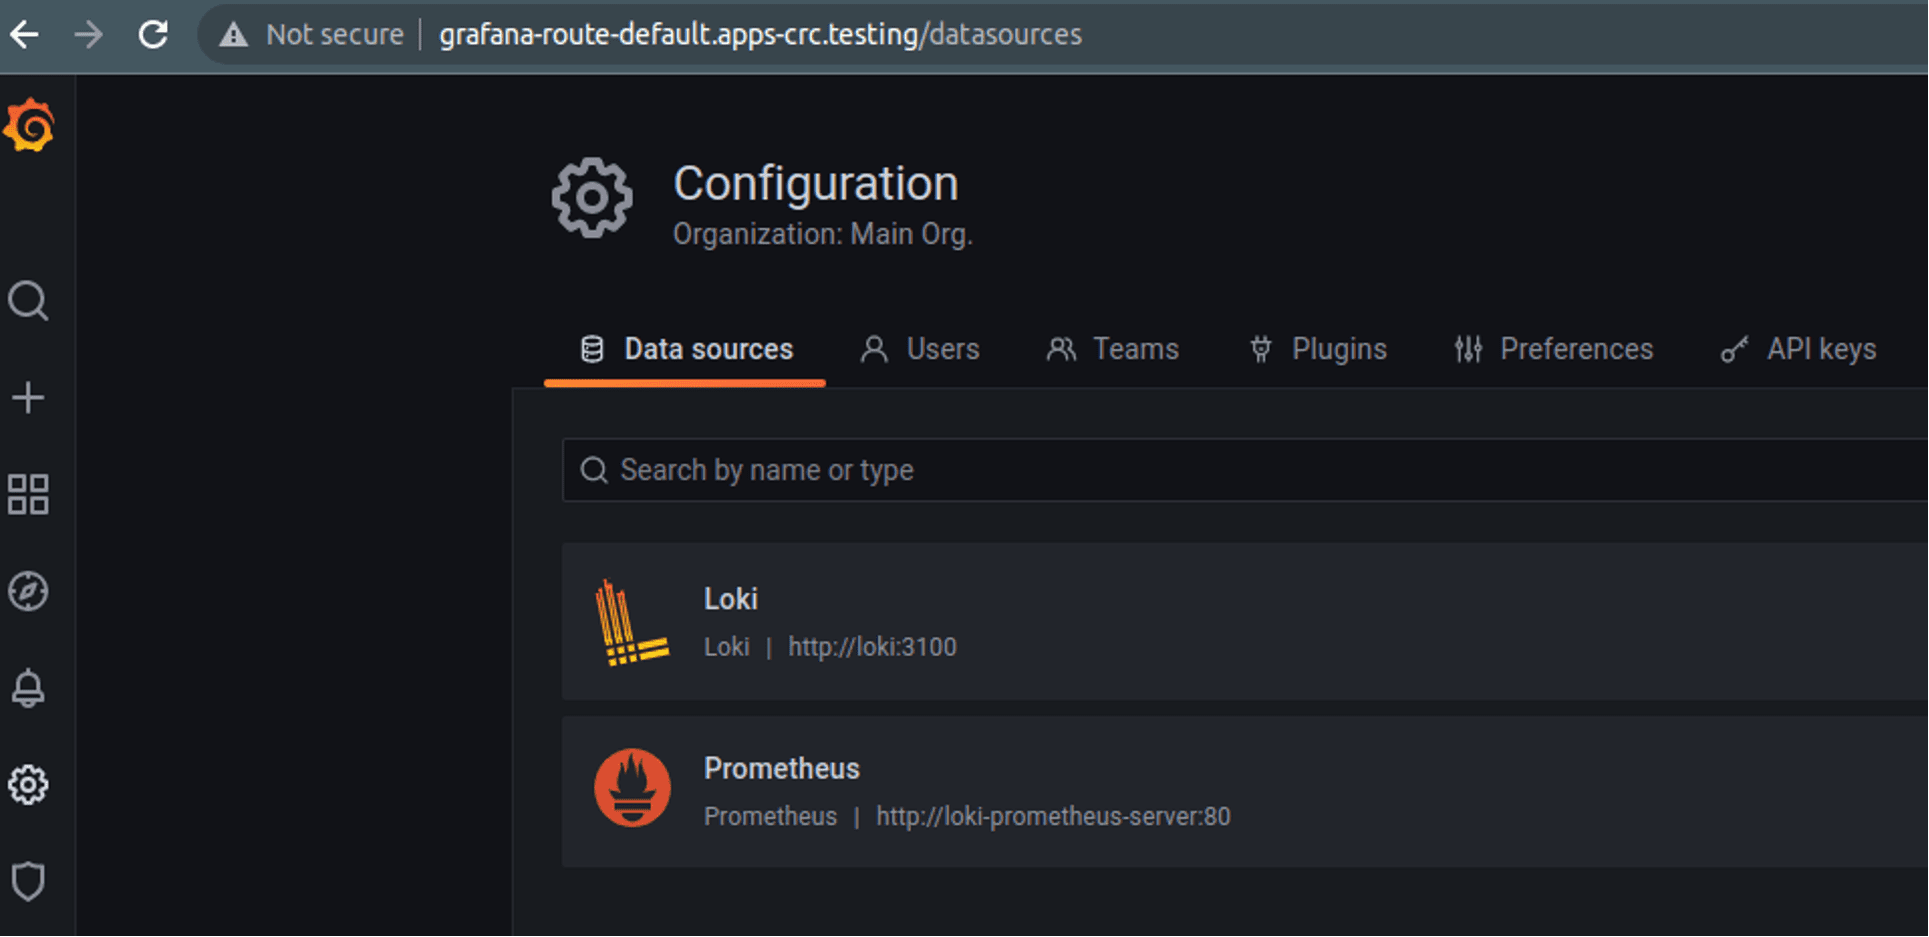
We can now start pushing logs to Loki to view them. No logs will currently be present as we disabled both PromTail and Fluent Bit deployments in the Helm installation.
We can set up our Fluent Bit configuration to send to the Loki service in the same namespace following the documentation for the Loki output plugin: https://docs.fluentbit.io/manual/pipeline/outputs/loki
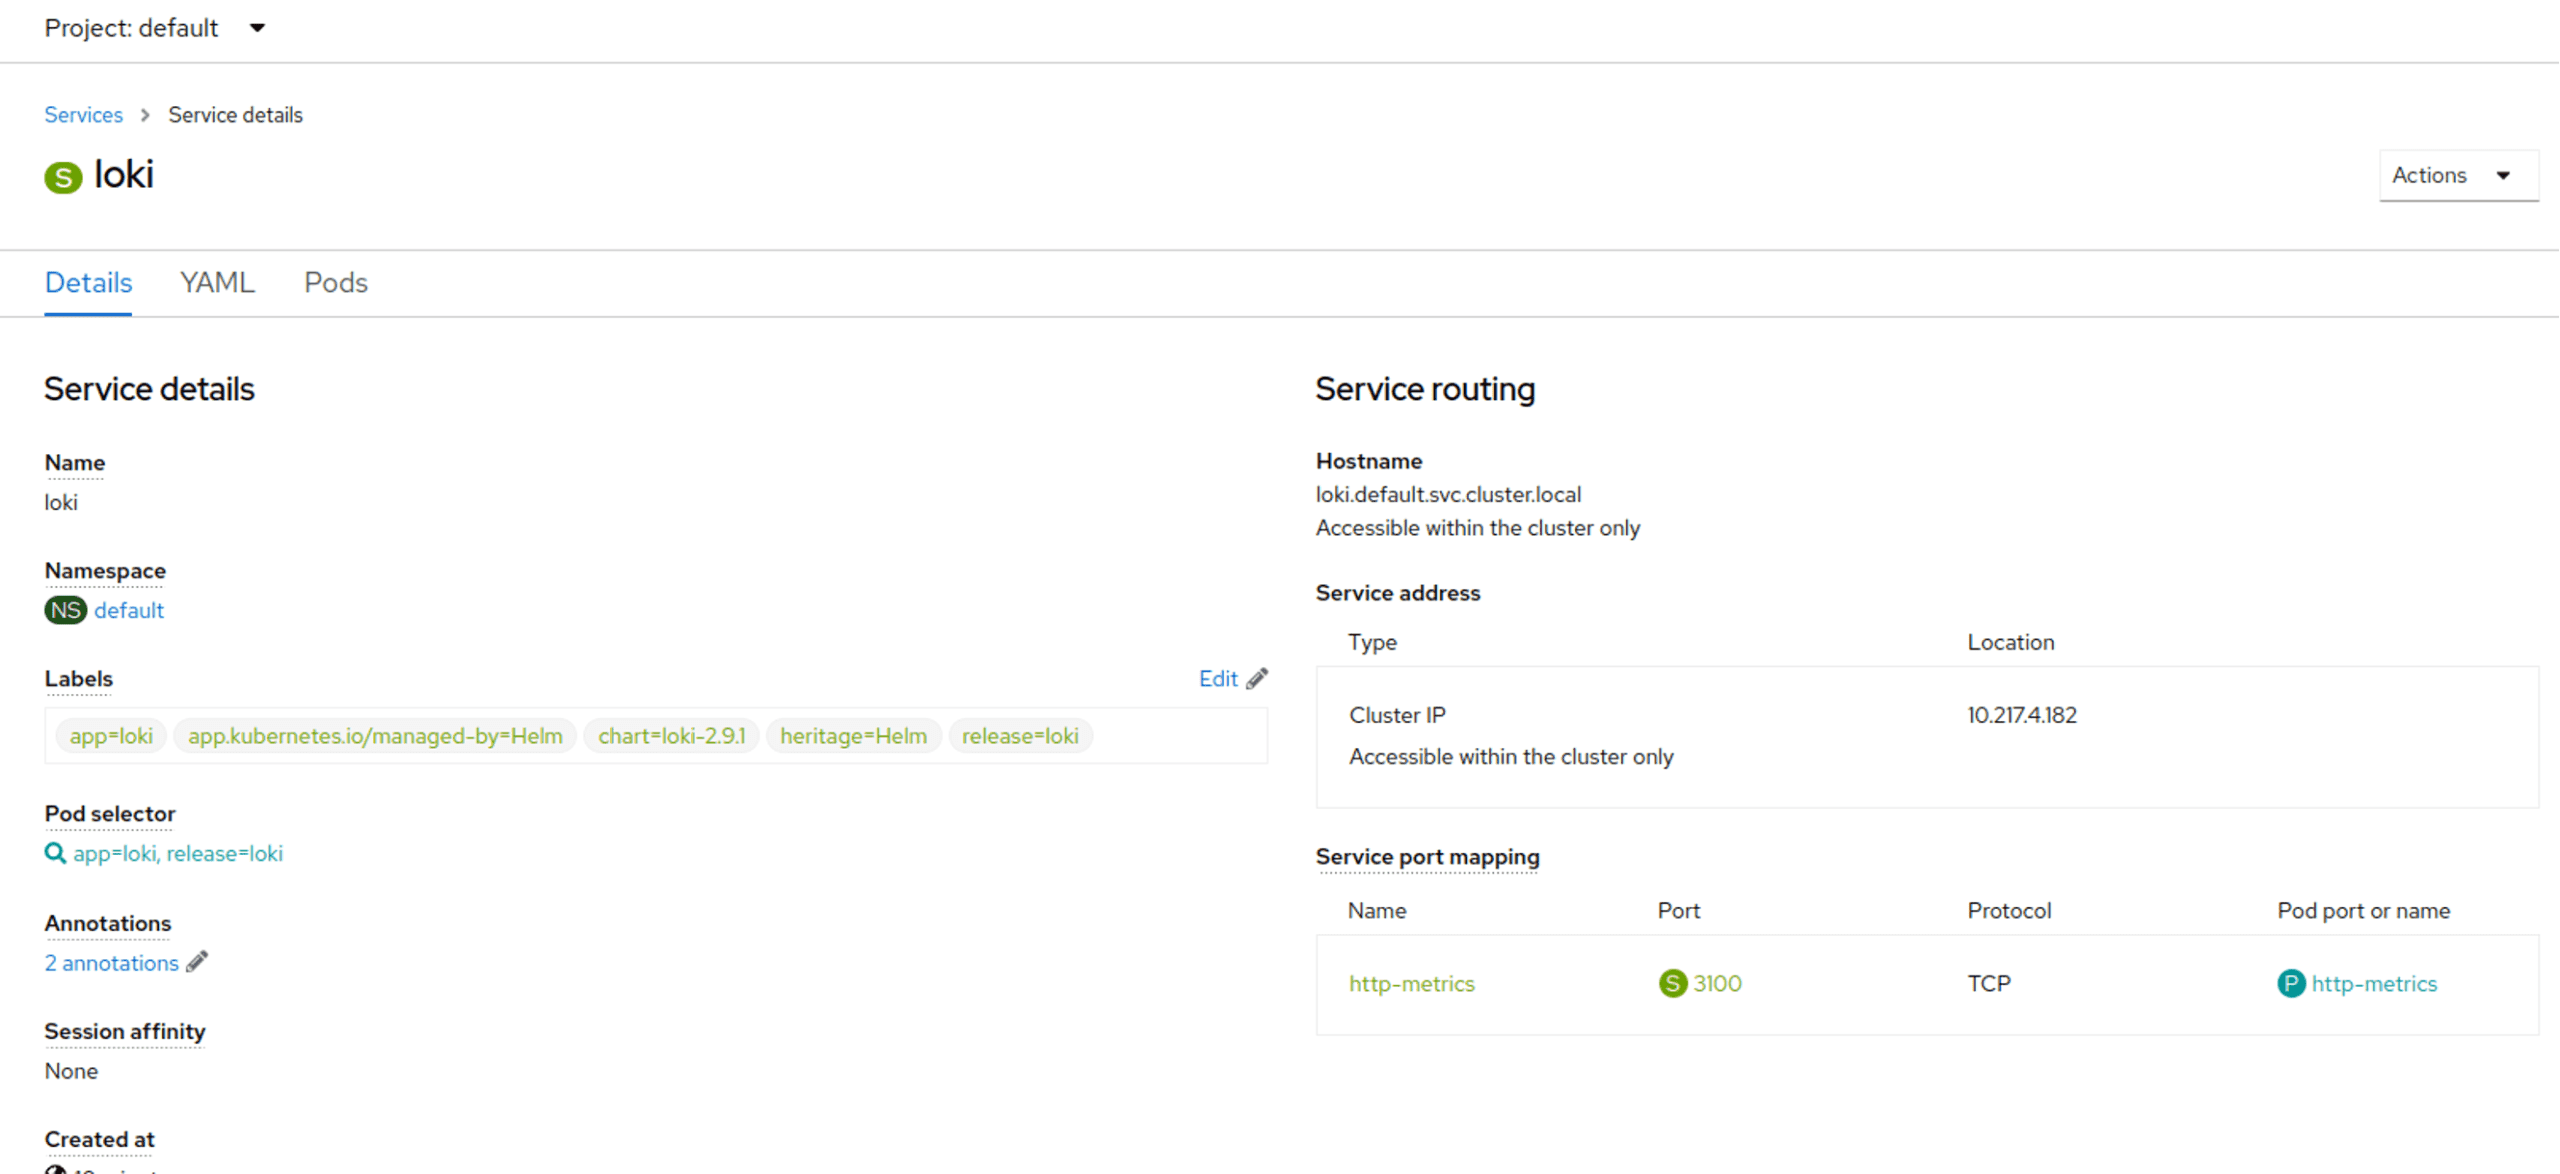
The URL we need is loki.default.svc.cluster.local and this is the fully qualifie domain name (FQDN) for our configuration. However we can just use loki.default as the hostname as we are in the same cluster. If we were in the same Kubernetes Namespace (or Openshift Project) then we could just use the service name of loki.
Add the following to our config map and make sure to restart the Fluent Bit pods (e.g. by using a Helm upgrade): configmap-fluent-bit-config.yaml
[OUTPUT]
Name loki
Match *
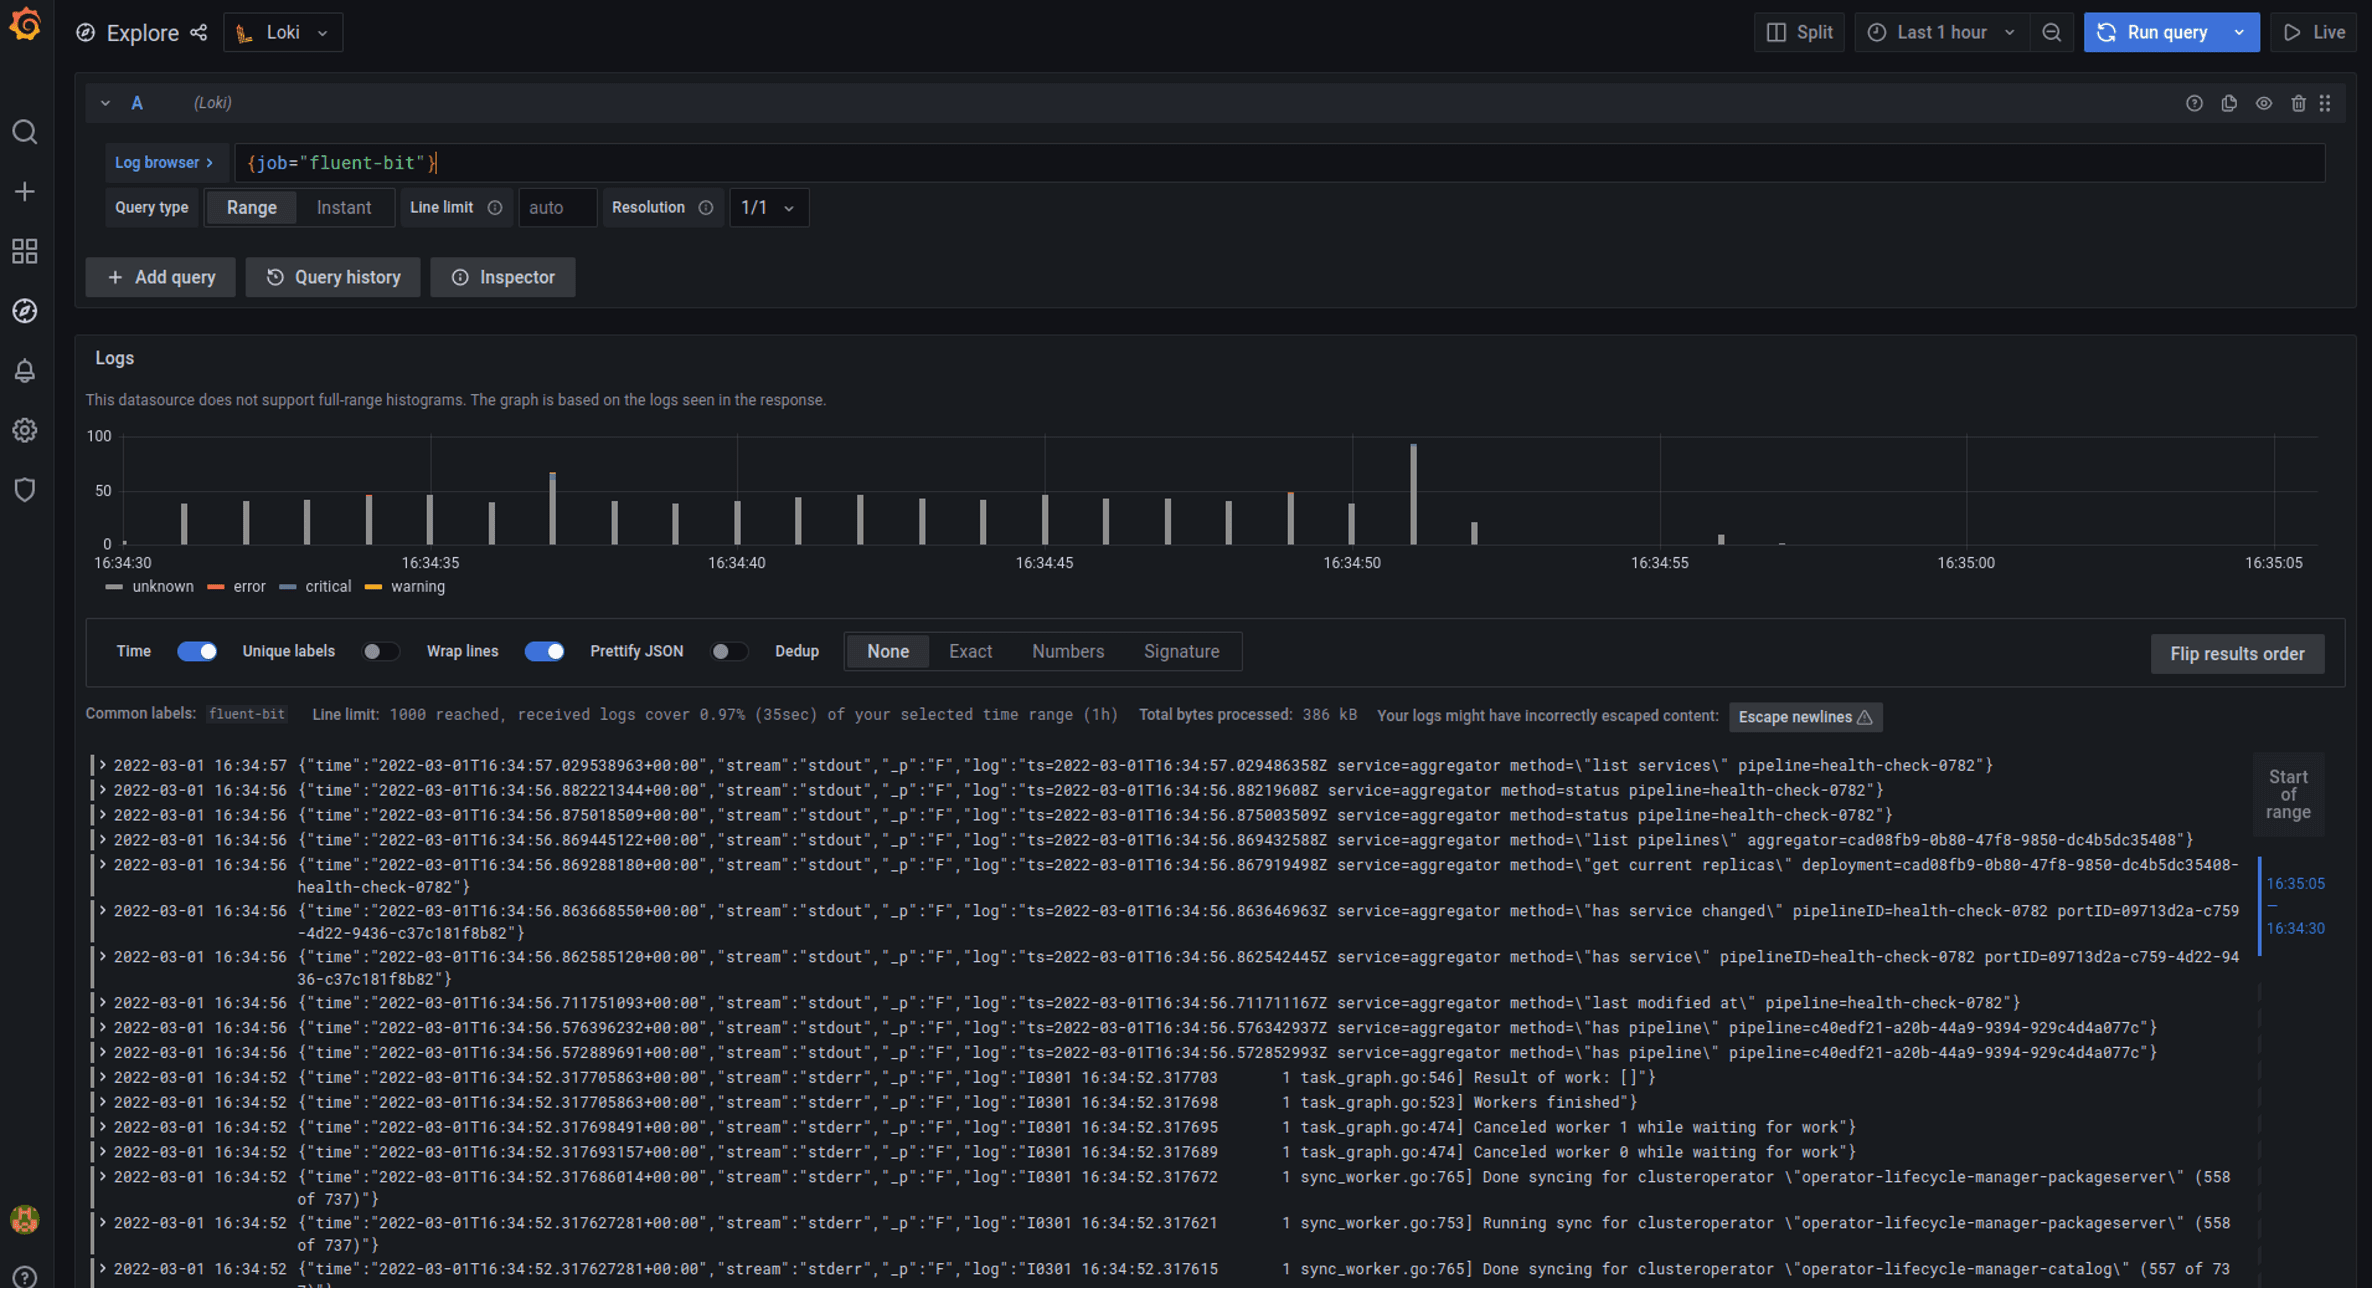
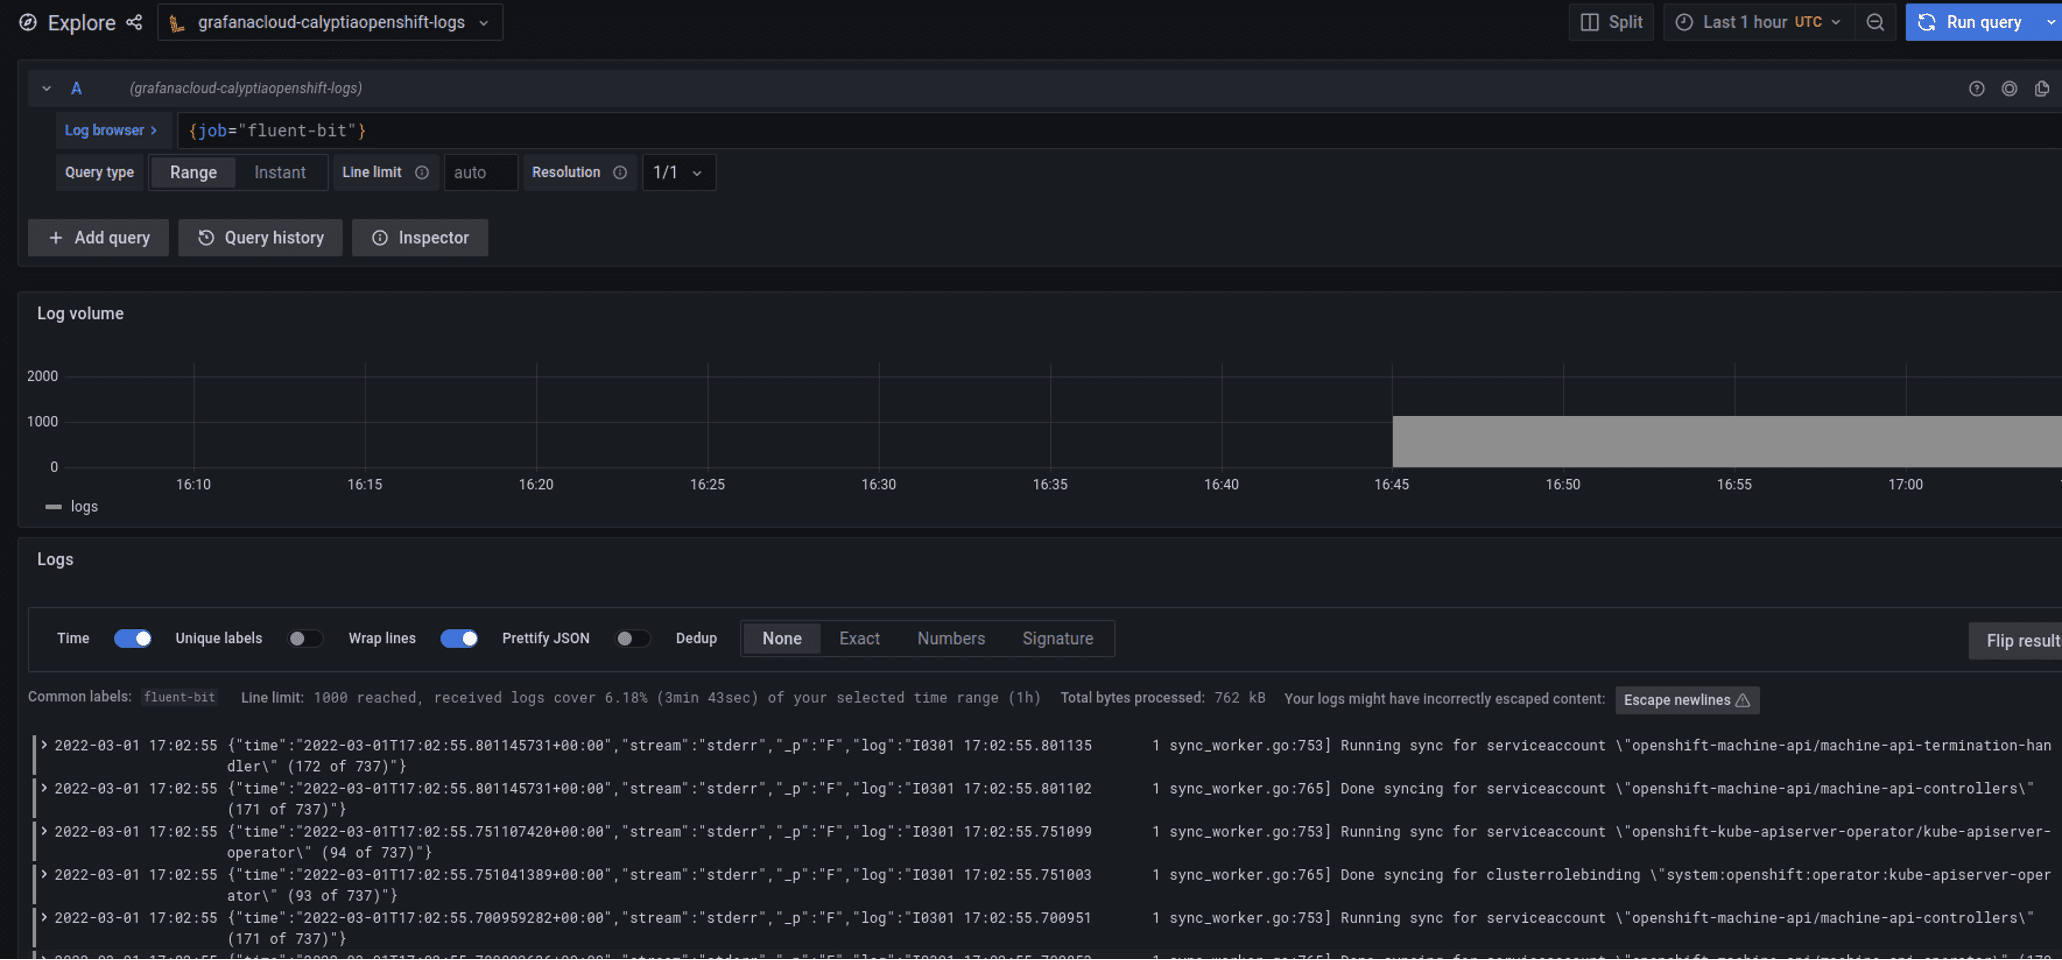
Host loki.defaultNow if we use the Grafana log explorer we should get logs. My URL is this in CRC but yours could be different: http://grafana-route-default.apps-crc.testing/explore?orgId=1&left=%5B%22now-1h%22,%22now%22,%22Loki%22,%7B%22refId%22:%22A%22,%22expr%22:%22%7Bjob%3D%5C%22fluent-bit%5C%22%7D%22%7D%5D
The main thing is to query on job=fluent-bit which is the default label applied as we do not override it.
Be aware that running a local stack all in a cluster like this on CRC is very much not recommended and will likely get overloaded very quickly.
Remote
Some additional configuration is required for Grafana Cloud but not much, the main thing is setting it up for your credentials. There is another blog post also covering this same area.
For my purposes I set up a new “stack” on Grafana Cloud just to segregate all this data from anything else we are using Grafana cloud for. Once you have that then instructions are provided on how to send logs to it: you will need to set up an API key (and its associated user) to use but this is all covered by the Grafana documentation and UI. It also provides you with the relevant URLs to ingest data.
You need to set up Basic Authentication to use a Grafana.com API key with the MetricsPublisher role: configmap-fluent-bit-config-remote.yaml
Once you have this information it can be inserted into the configuration below or using the template in the example repository.
[OUTPUT]
  Name loki
  Match *
  Host $GRAFANA_CLOUD_LOKI_URL
  port 443
  tls on
  tls.verify on
  http_user $GRAFANA_CLOUD_LOKI_USERNAME
  http_passwd $GRAFANA_CLOUD_APIKEY
  tenant_id openshift
Now following the set up from the Grafana Cloud documentation we can add the relevant Loki datasource into Grafana and see it:
Gather Metrics with Fluent Bit
Fluent Bit supports the two pillars of observability in that it provides logs and metrics. Metrics can be consumed from various inputs and send to outputs, in a similar pipeline to logs.
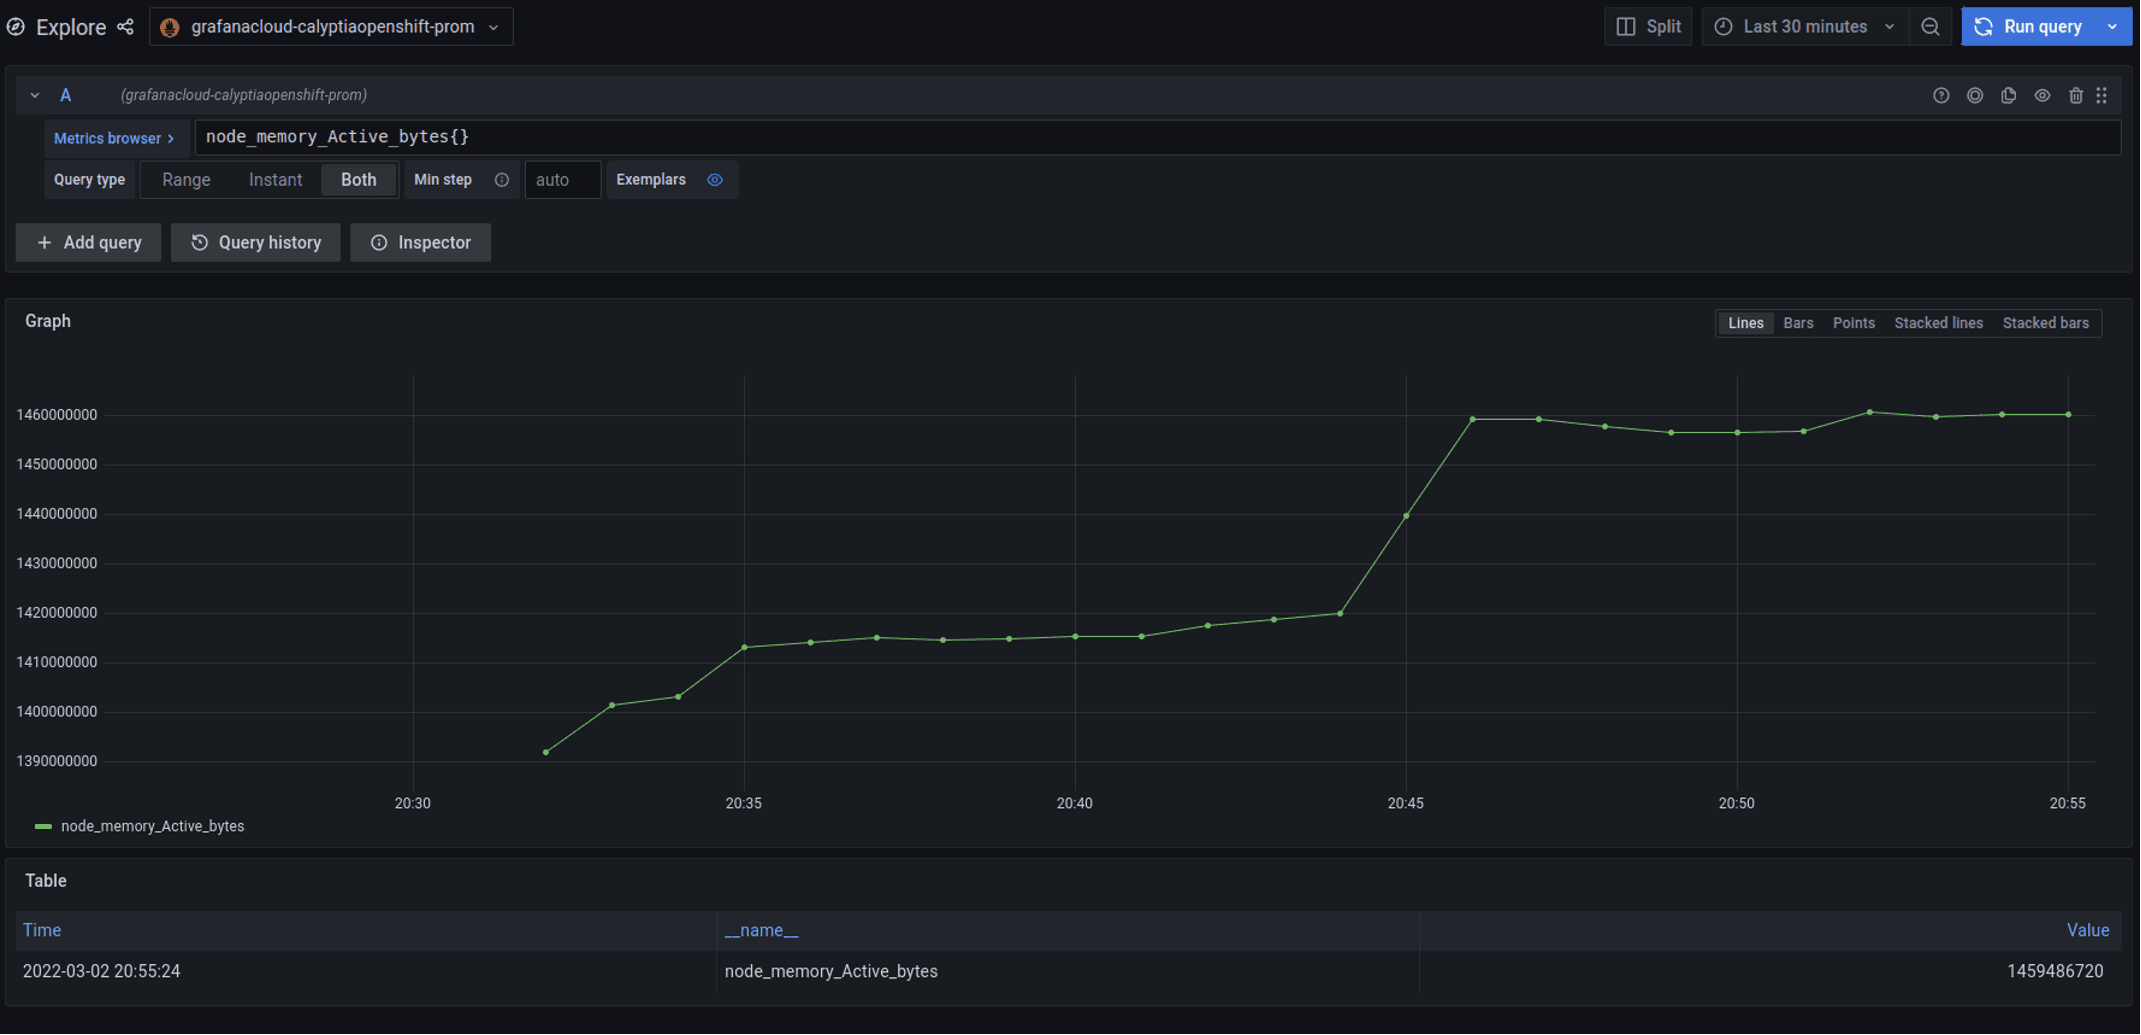
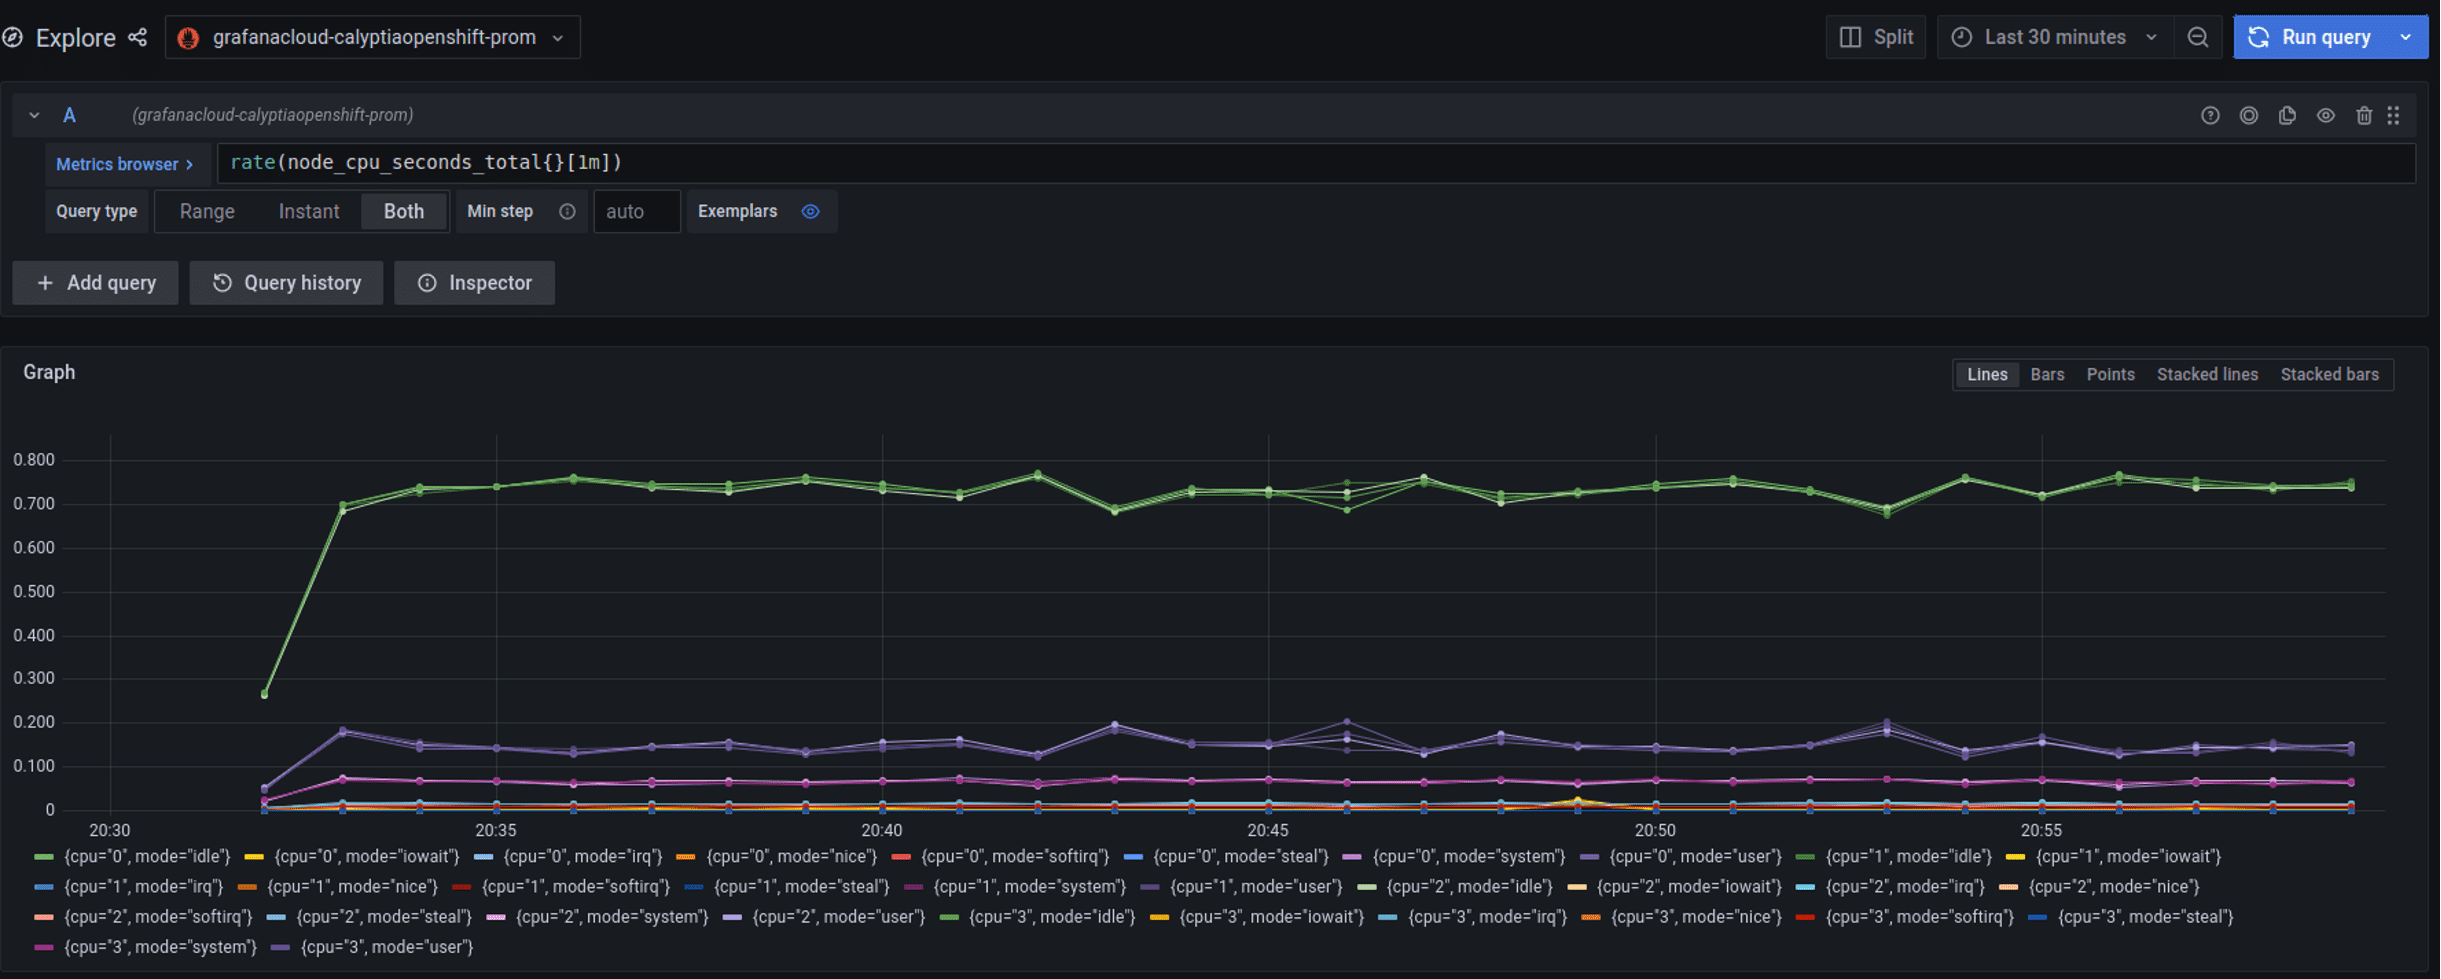
In this case, we will use Fluent Bit to provide Node Exporter metrics, i.e. node metrics on CPU, etc., to Grafana Cloud via the Prometheus Remote Write output plugin.
To achieve this, the main things to add are the node exporter input (which requires additional mounts for those metrics from the host) and the Prometheus output. The host /sys and /proc filesystems can be mounted read-only as /host/sys and /host/proc to be used then with the node exporter input plugin:
[INPUT]
  name node_exporter_metrics
  tag node_metrics
  path.procfs /host/proc
  path.sysfs /host/sys
We can then configure Prometheus output as well, in this case for Grafana cloud but you can see how it could be targeting any other Prometheus instance or tool that supports it:
[OUTPUT]
  name prometheus_remote_write
  host $GRAFANA_CLOUD_PROM_URL
  match *
  uri /api/prom/push
  port 443
  tls on
  tls.verify on
  http_user $GRAFANA_CLOUD_PROM_USERNAME
  http_passwd $GRAFANA_CLOUD_APIKEY
This then provides the host metrics to Grafana Cloud.
Elastic Cloud integration
To integrate with Elastic Cloud, the main thing to focus on is ensuring that you have the right credentials and ID to use for configuring Fluent Bit. At the time of this article, this information can be found here: https://www.elastic.co/guide/en/cloud/current/ec-cloud-id.html
A complete working example that lets you substitute your own credentials is provided here that uses the official Helm chart to deploy Calyptia Fluent Bit with all the relevant security configuration included: https://github.com/calyptia/openshift-fluent-bit-examples/tree/main/elastic-cloud
In addition to this article and the example, also refer to the Elasticsearch output plugin documentation: https://docs.fluentbit.io/manual/pipeline/outputs/elasticsearch
When you create a new deployment you get given the Beats credentials which can then be used by Fluent Bit:
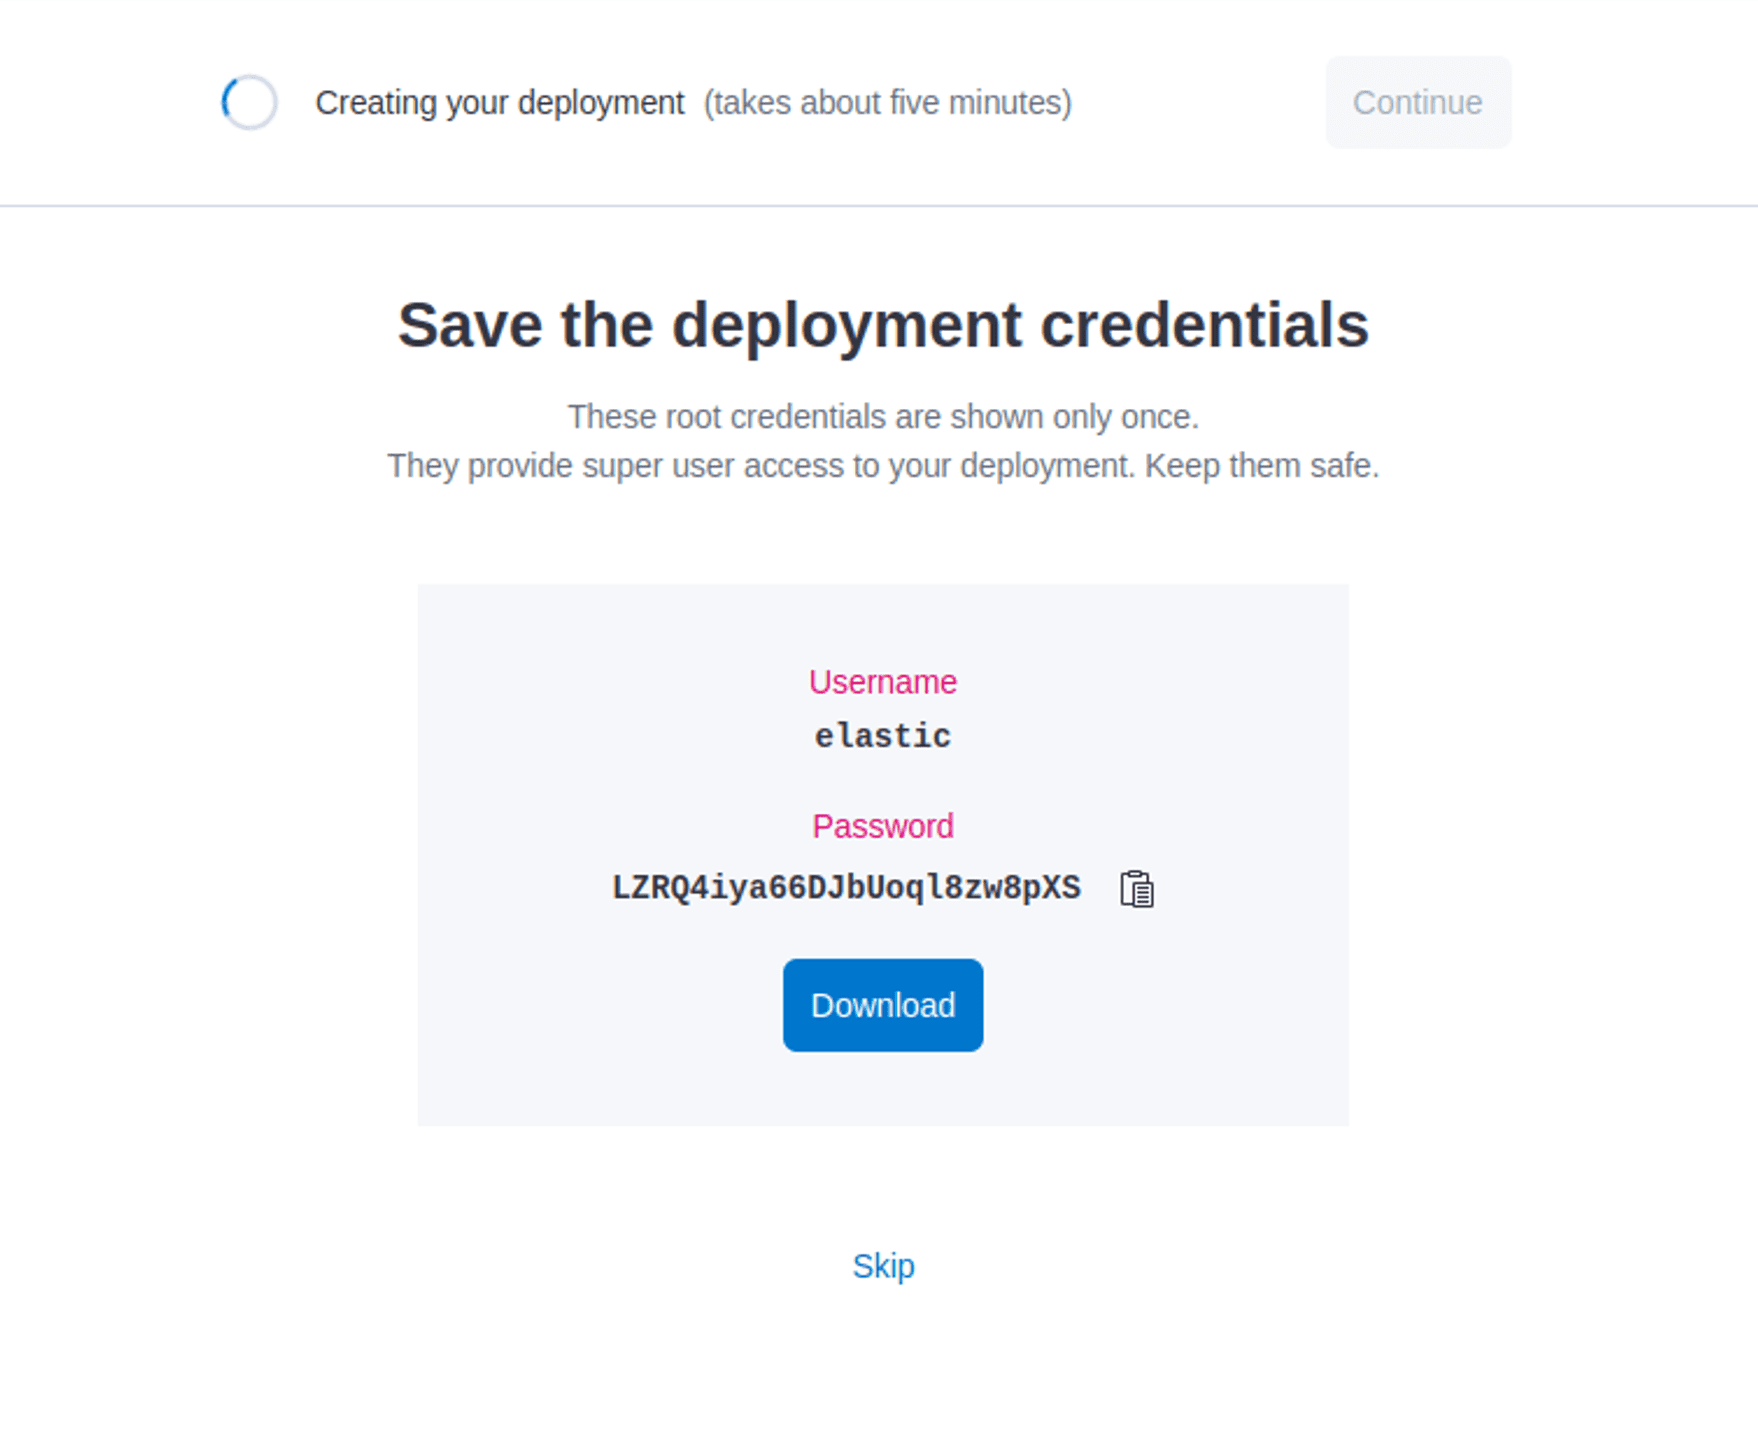
These can also be retrieved later using the Elastic Cloud API but refer to the Elastic documentation for full details
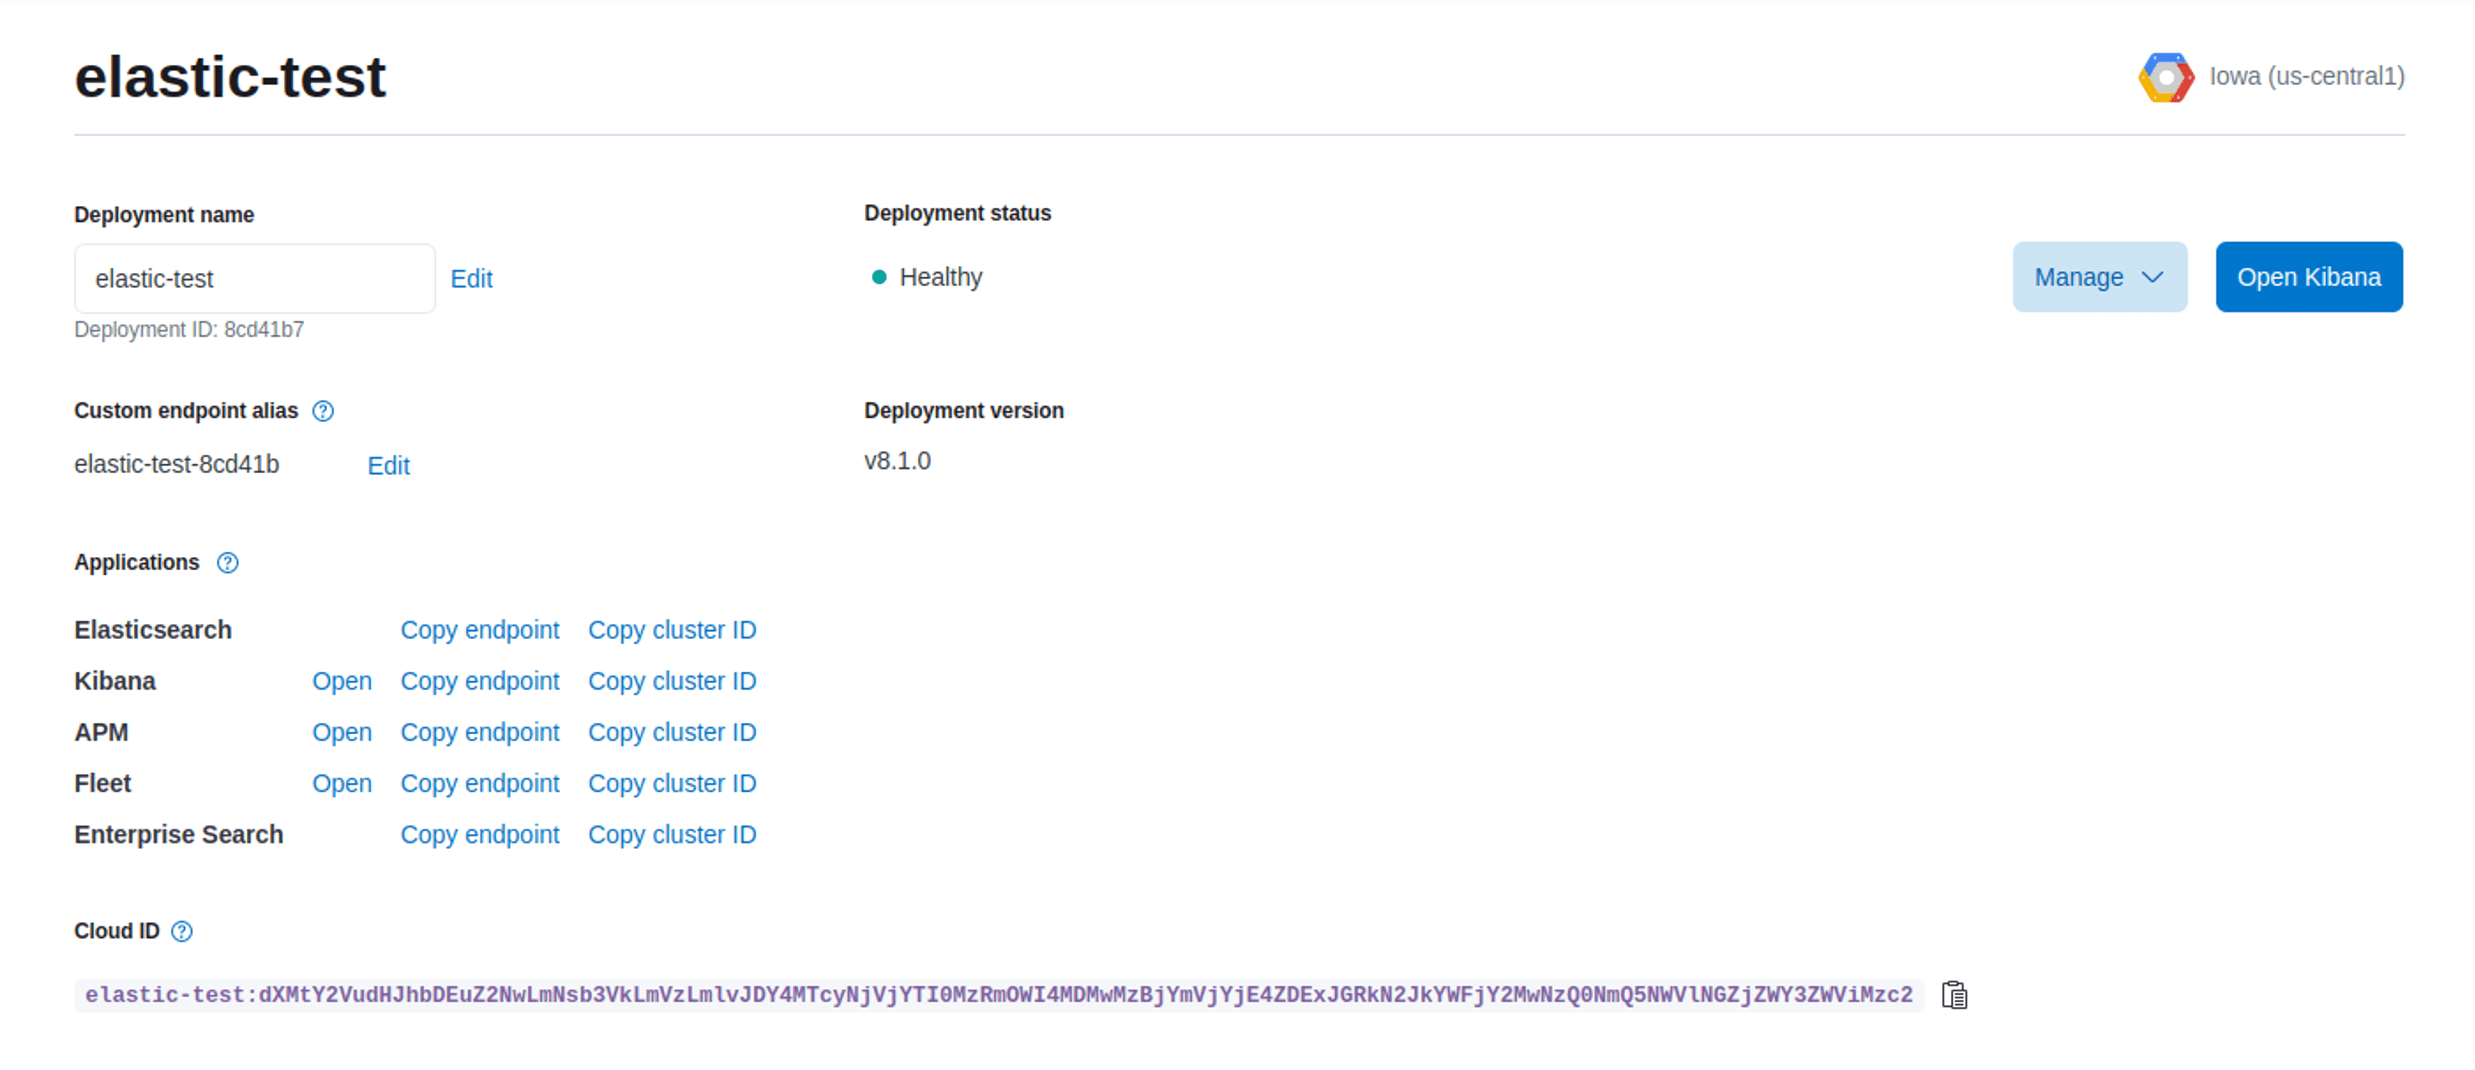
The Cloud ID can be retrieved from your instance details under the management view:
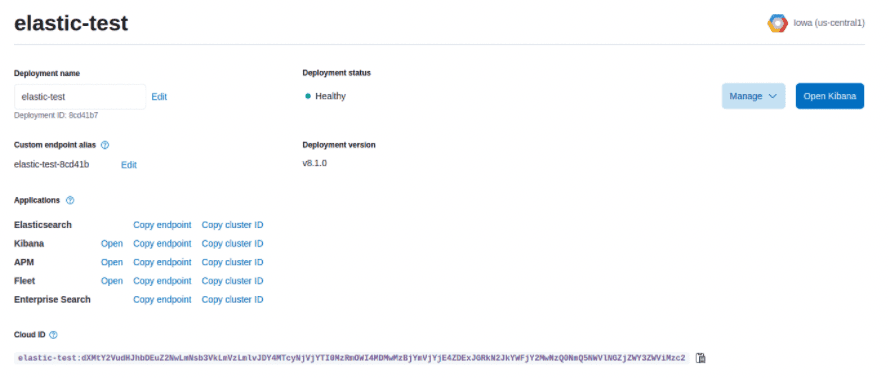
If it is missing or incorrect you will not be able to communicate so get lots of failures reported similar to this:
[2022/03/18 11:23:17] [ warn] [engine] failed to flush chunk '1-1647602596.725620402.flb', retry in 9 seconds: task_id=9, input=tail.0 > output=es.0 (out_id=0)
[2022/03/18 11:23:17] [error] [output:es:es.0] HTTP status=404 URI=/_bulk, response:
{"error":"404 page not found"}
If you see errors like the following, ensure Suppress_Type_Name On is set to ensure we support the v7+ API required by Elastic Cloud (currently on v8):
{"error":{"root_cause":[{"type":"illegal_argument_exception","reason":"Action/metadata line [1] contains an unknown parameter [_type]"}],"type":"illegal_argument_exception","reason":"Action/metadata line [1] contains an unknown parameter [_type]"},"status":400}Now, you should not get any errors at least initially with CRC. Unfortunately sustaining the traffic to Elastic Cloud on my test PC using code ready containers was not possible so I started seeing failures pushing later. Make sure you have a deployment that can sustain the necessary network and other resources to push to Elastic Cloud.
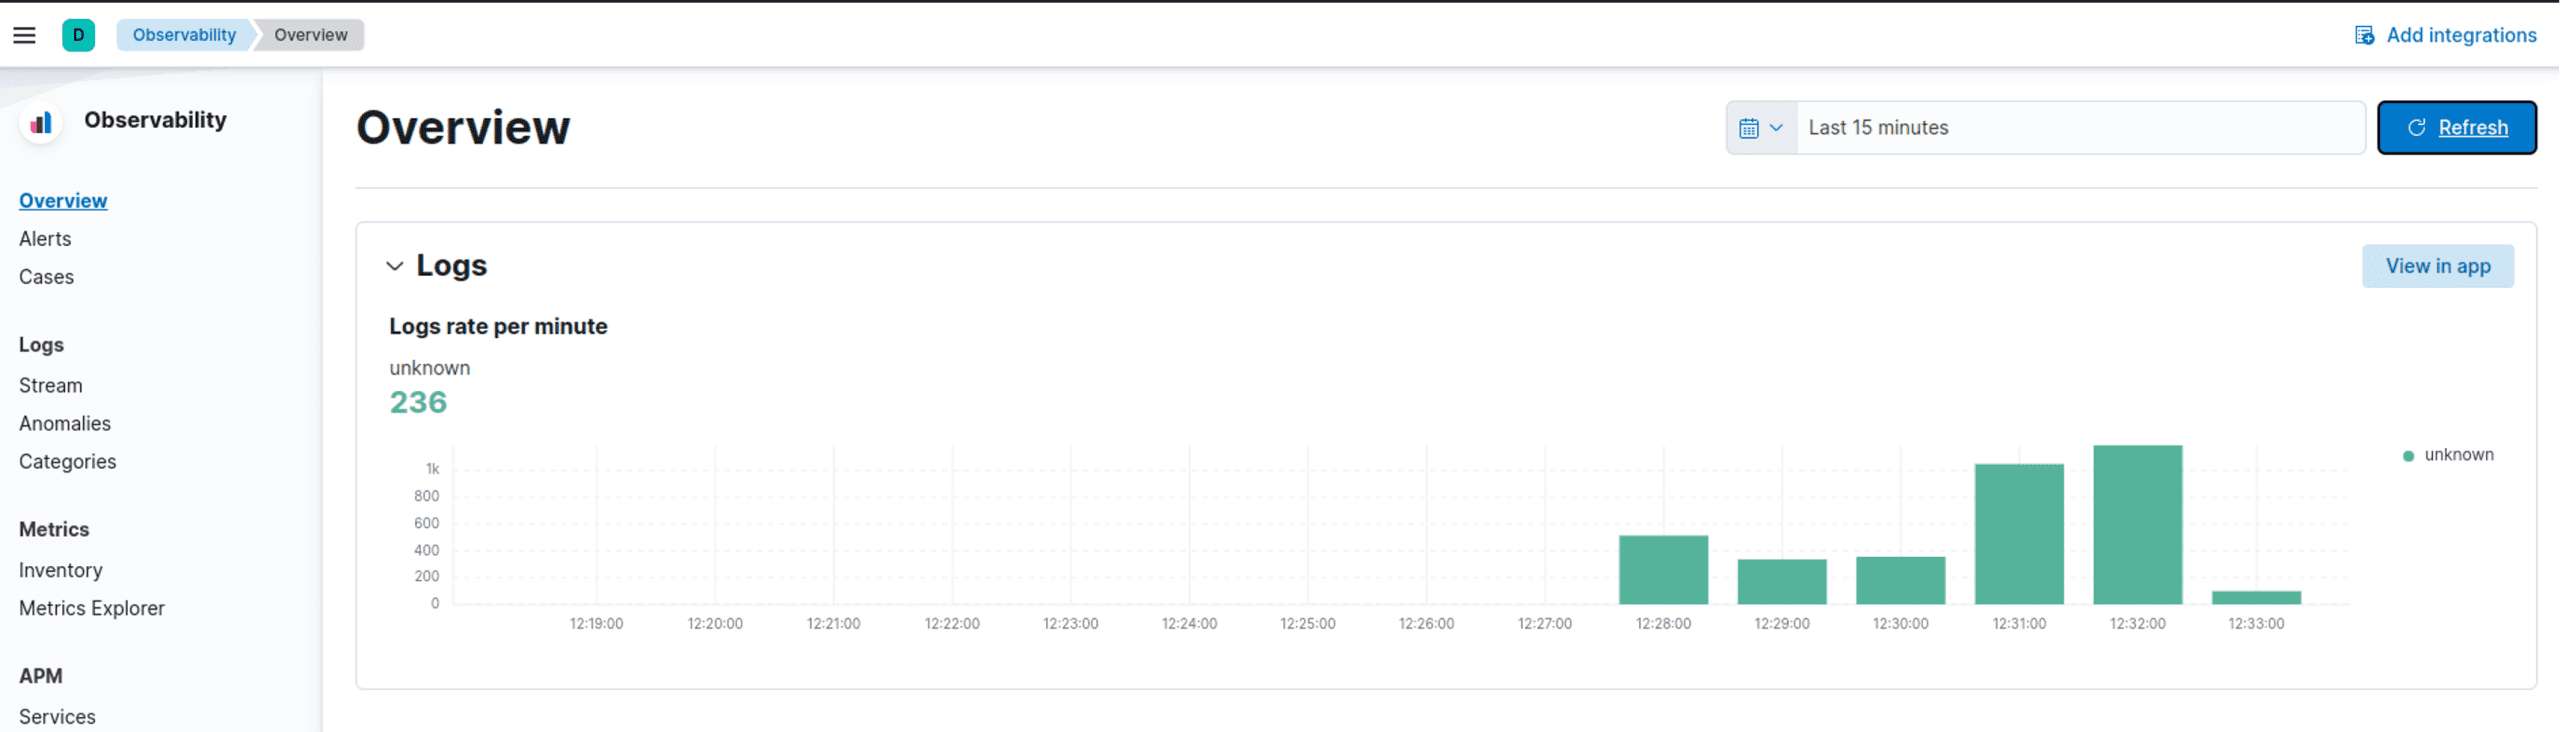
It is not always obvious but the default fluent-bit index should now be visible in Kibana:
Congratulations, your logs are in Elasticsearch!
Kibana defaults to different names for its indices for logs so it may be worthwhile changing that in your configuration to simplify integration:
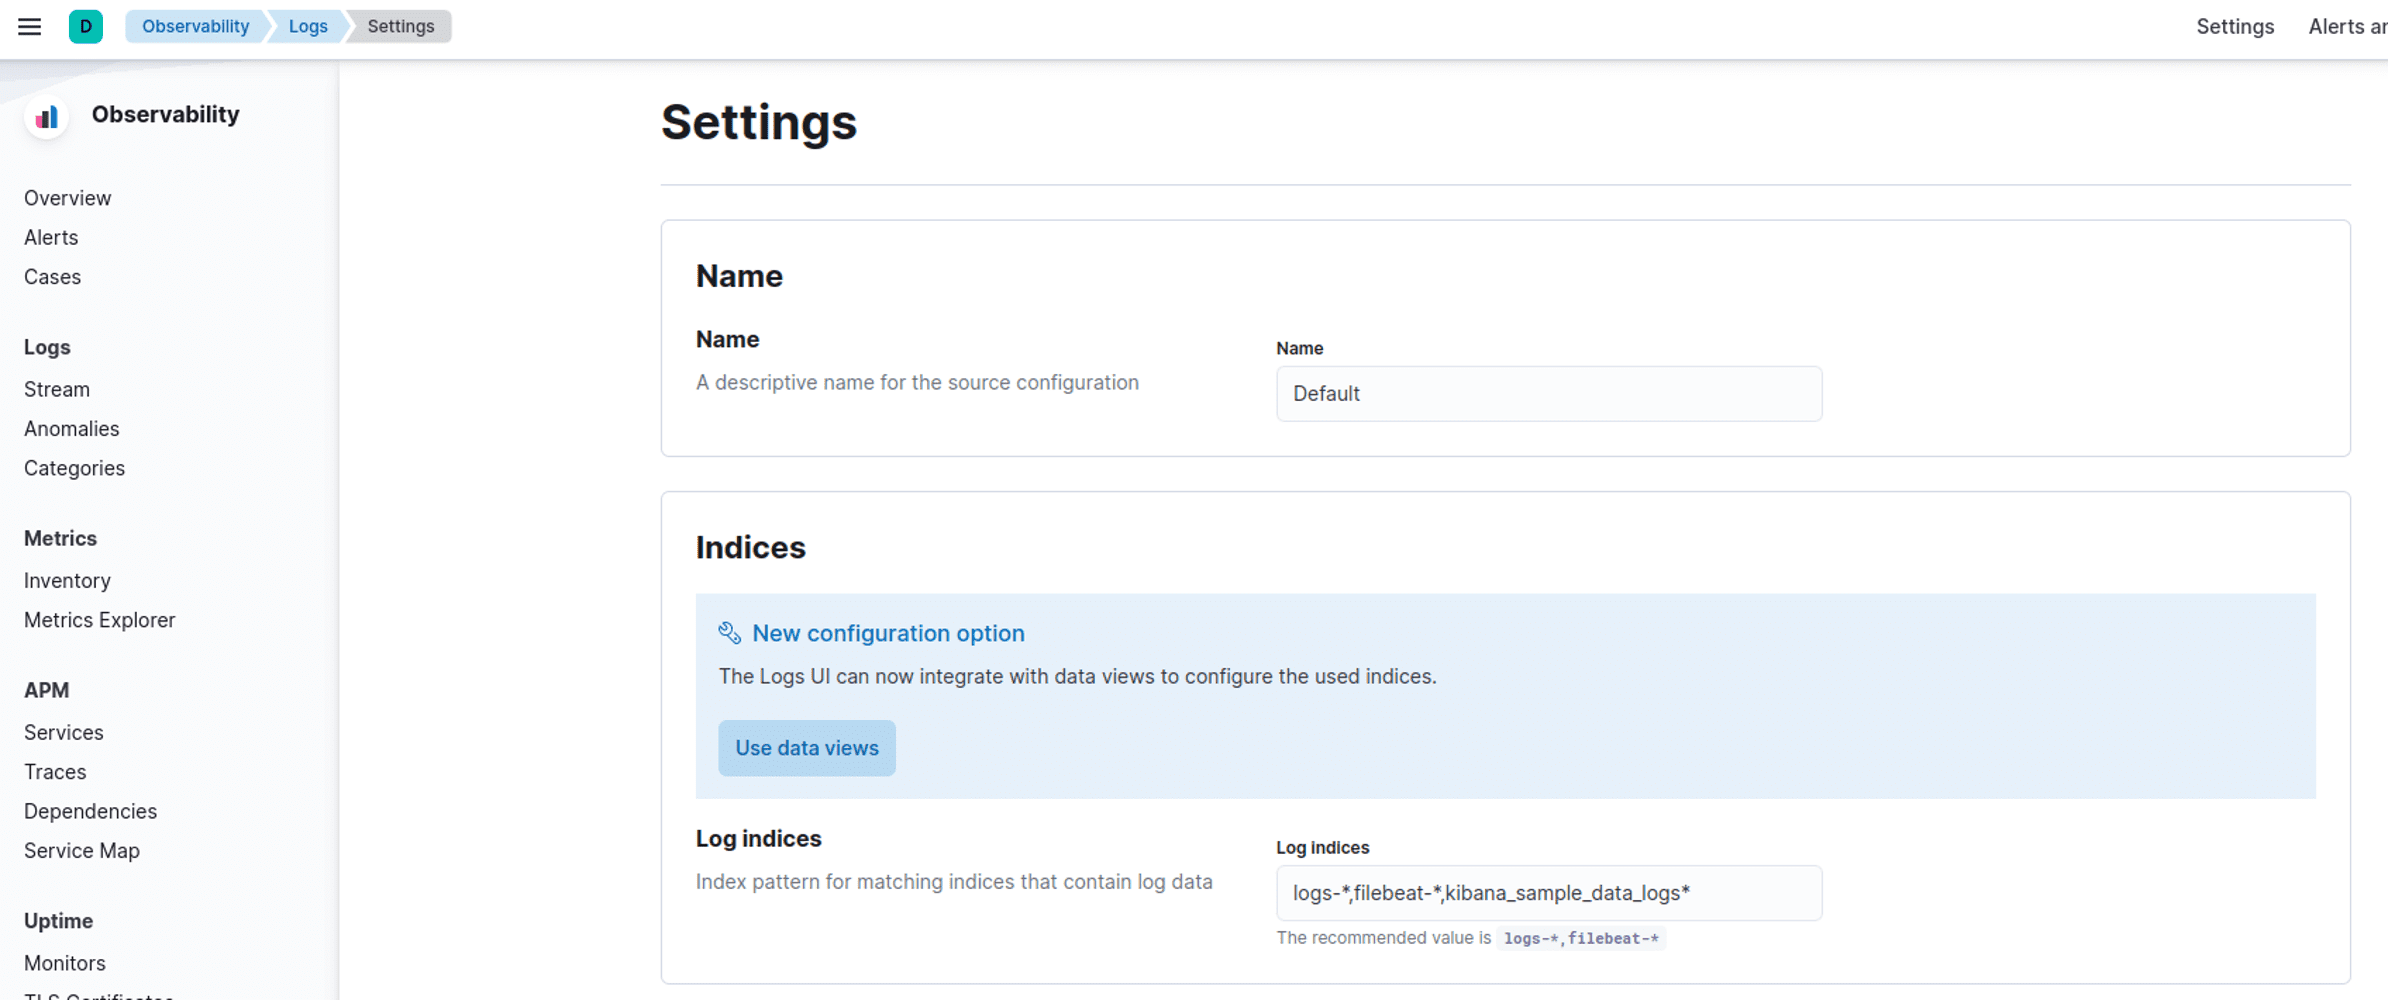
As you can see it is looking for various prefixes including logs-*.
We can modify our configuration to either use logstash_format or in this case just explicitly set the index to logs-fluent-bit. If that is done then we see our logs in Kibana with no additional configuration like so.
My final configuration is therefore the following:
[OUTPUT]
  name es
  match *
  tls On
  tls.verify On
  Suppress_Type_Name On
  Index logs-fluent-bit
  Cloud_Auth $ELASTIC_CLOUD_AUTH
  Cloud_ID $ELASTIC_CLOUD_ID
The Calyptia repository has a script to automate all this deployment via the Helm chart to simplify everything for you.
DataDog integration
Similar to Elastic and Grafana Cloud integrations, we can also target Datadog. The official documentation is a good guide for this but we will also walk through this as part of this article to cover any niggles.
Refer to the main documentation for the full configuration available: https://docs.fluentbit.io/manual/pipeline/outputs/datadog
Set up your datadog account and create an API key to use or grab the default one used by the agents when deployed – the docker instructions include this as part of the command line so it is easy to find.
To ingest logs, we need to ensure ensure log ingestion is activated: the easiest way is to send some logs in via another means. If you do not do this then you will get a 403 Permission Denied error which confused me for a bit.
A simple way to activate it for me was just to run the container agent locally which also gives you the API key you need.
$ docker run -d --name datadog-agent -e DD_API_KEY=XXX -e DD_LOGS_ENABLED=true -e DD_LOGS_CONFIG_CONTAINER_COLLECT_ALL=true -e DD_CONTAINER_EXCLUDE_LOGS="name:datadog-agent" -e DD_SITE="datadoghq.eu" -v /var/run/docker.sock:/var/run/docker.sock:ro -v /proc/:/host/proc/:ro -v /opt/datadog-agent/run:/opt/datadog-agent/run:rw -v /sys/fs/cgroup/:/host/sys/fs/cgroup:ro datadog/agent:latestProvide the API key and ensure you are targeting the right part of the world for ingestion, e.g. EU is different to US for the target URL The docs also show you how to test ingestion with your actual key and URL: https://docs.datadoghq.com/api/latest/logs/
$ export DD_API_KEY=XXX
$ curl -X POST "https://http-intake.logs.datadoghq.eu/api/v2/logs" -H "Content-Type: application/json" -H "DD-API-KEY: ${DD_API_KEY}" -d @- << EOF
[
{
"message": "hello"
},
{
"message": "world"
}
]
EOF
Once we have this working we know we should be able to send logs into Datadog. Now it is time to configure Fluent Bit to do it using the URL for your geographical region and the API key exposed above.
The example configuration includes various variables you can substitute for all this:
[OUTPUT]
Name datadog
Match *
Host http-intake.logs.$DATADOG_SITE
TLS on
compress gzip
apikey $DATADOG_API_KEY
dd_service $DATADOG_SERVICE
dd_source $DATADOG_SOURCE
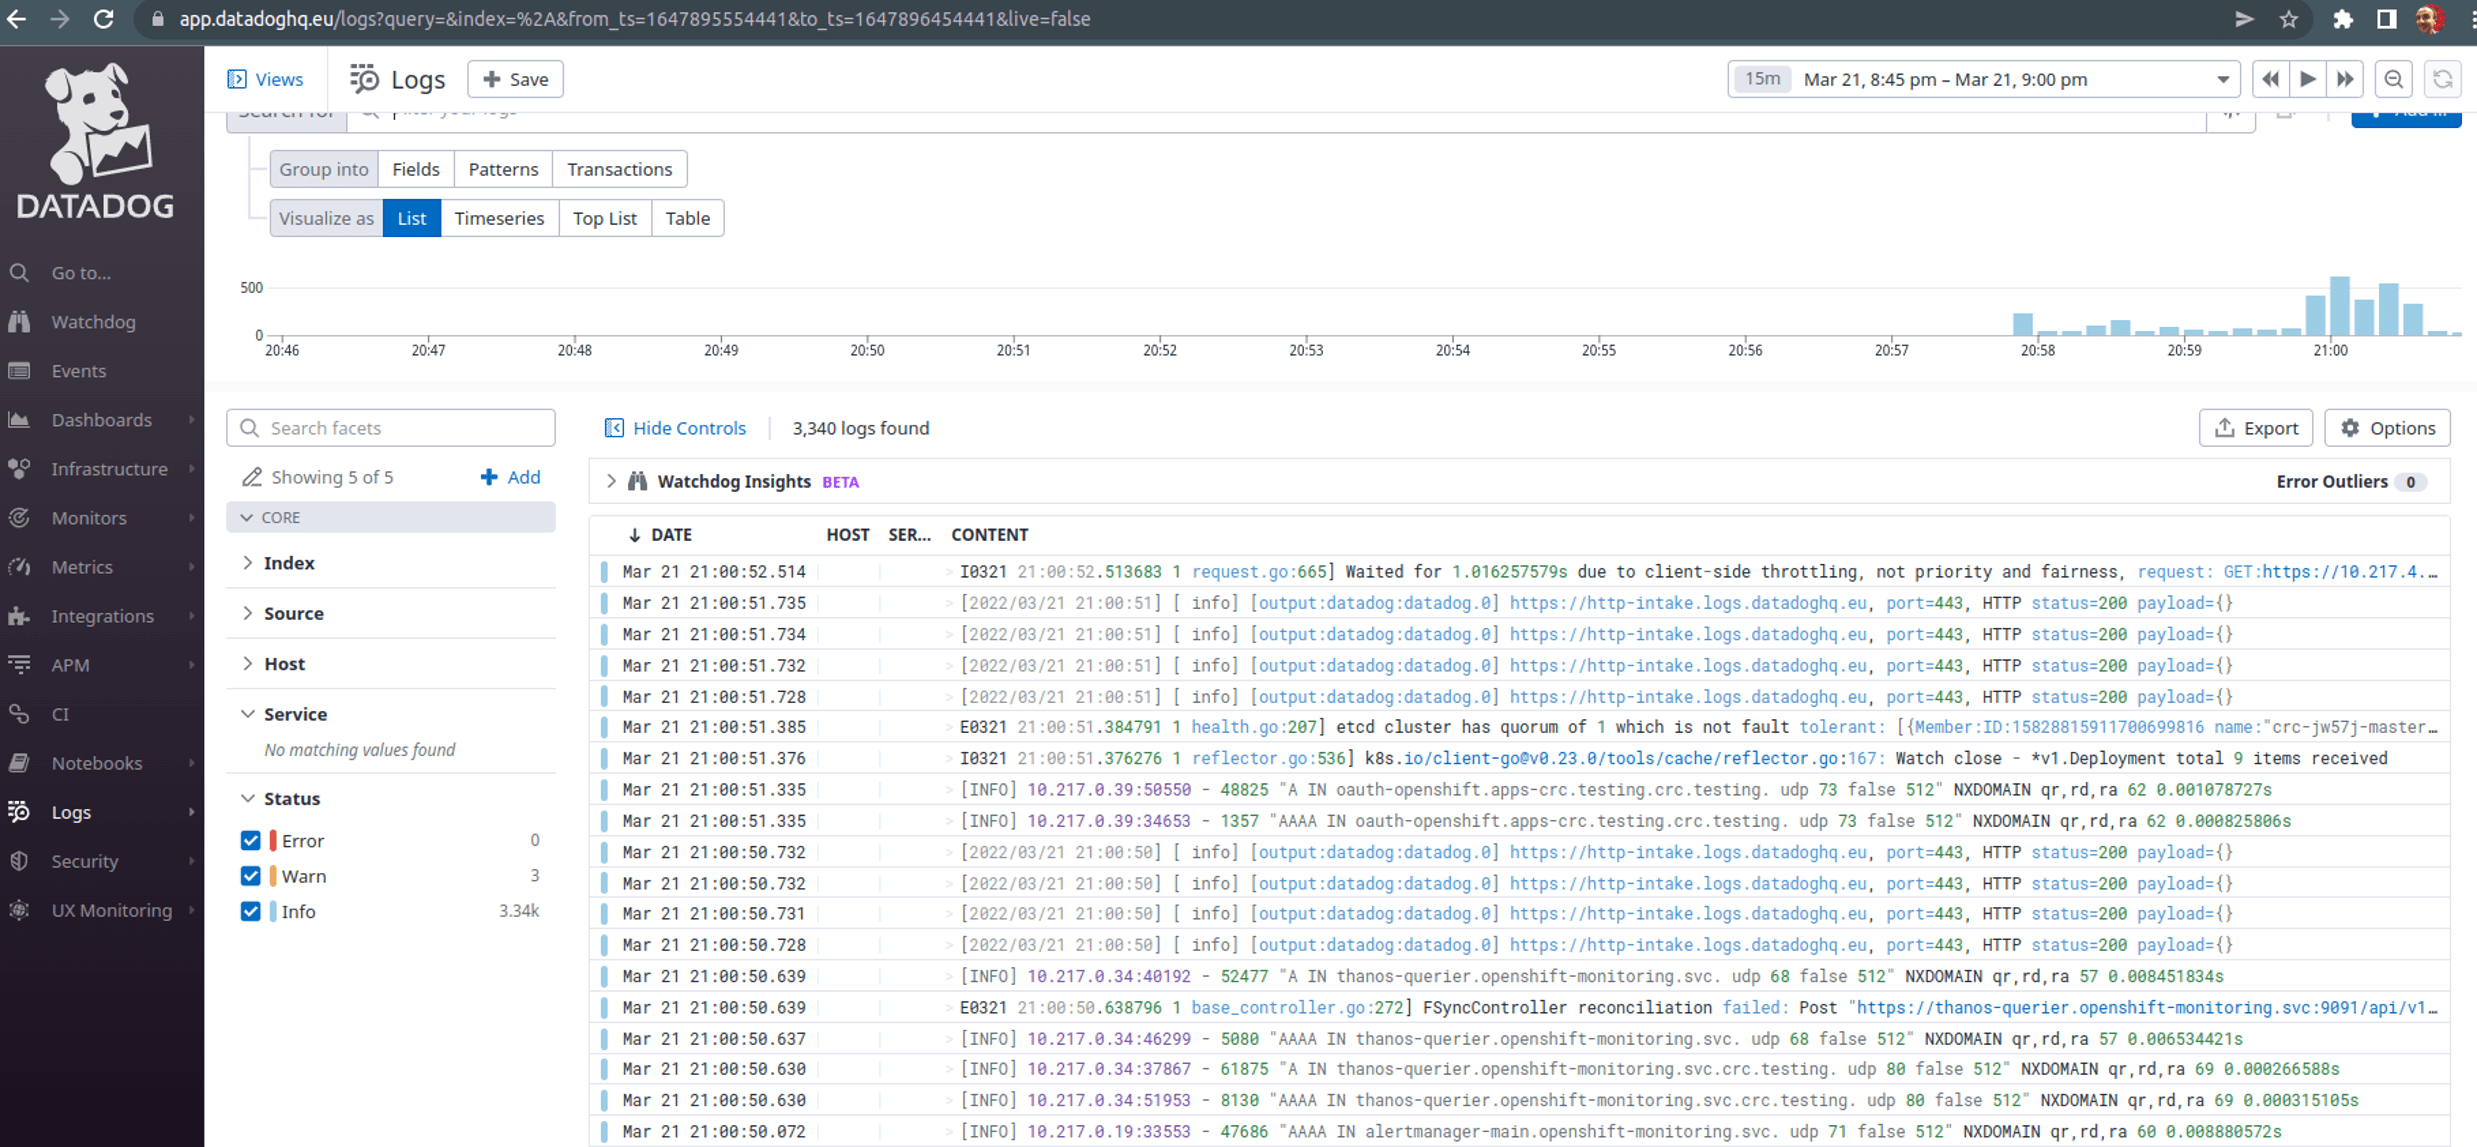
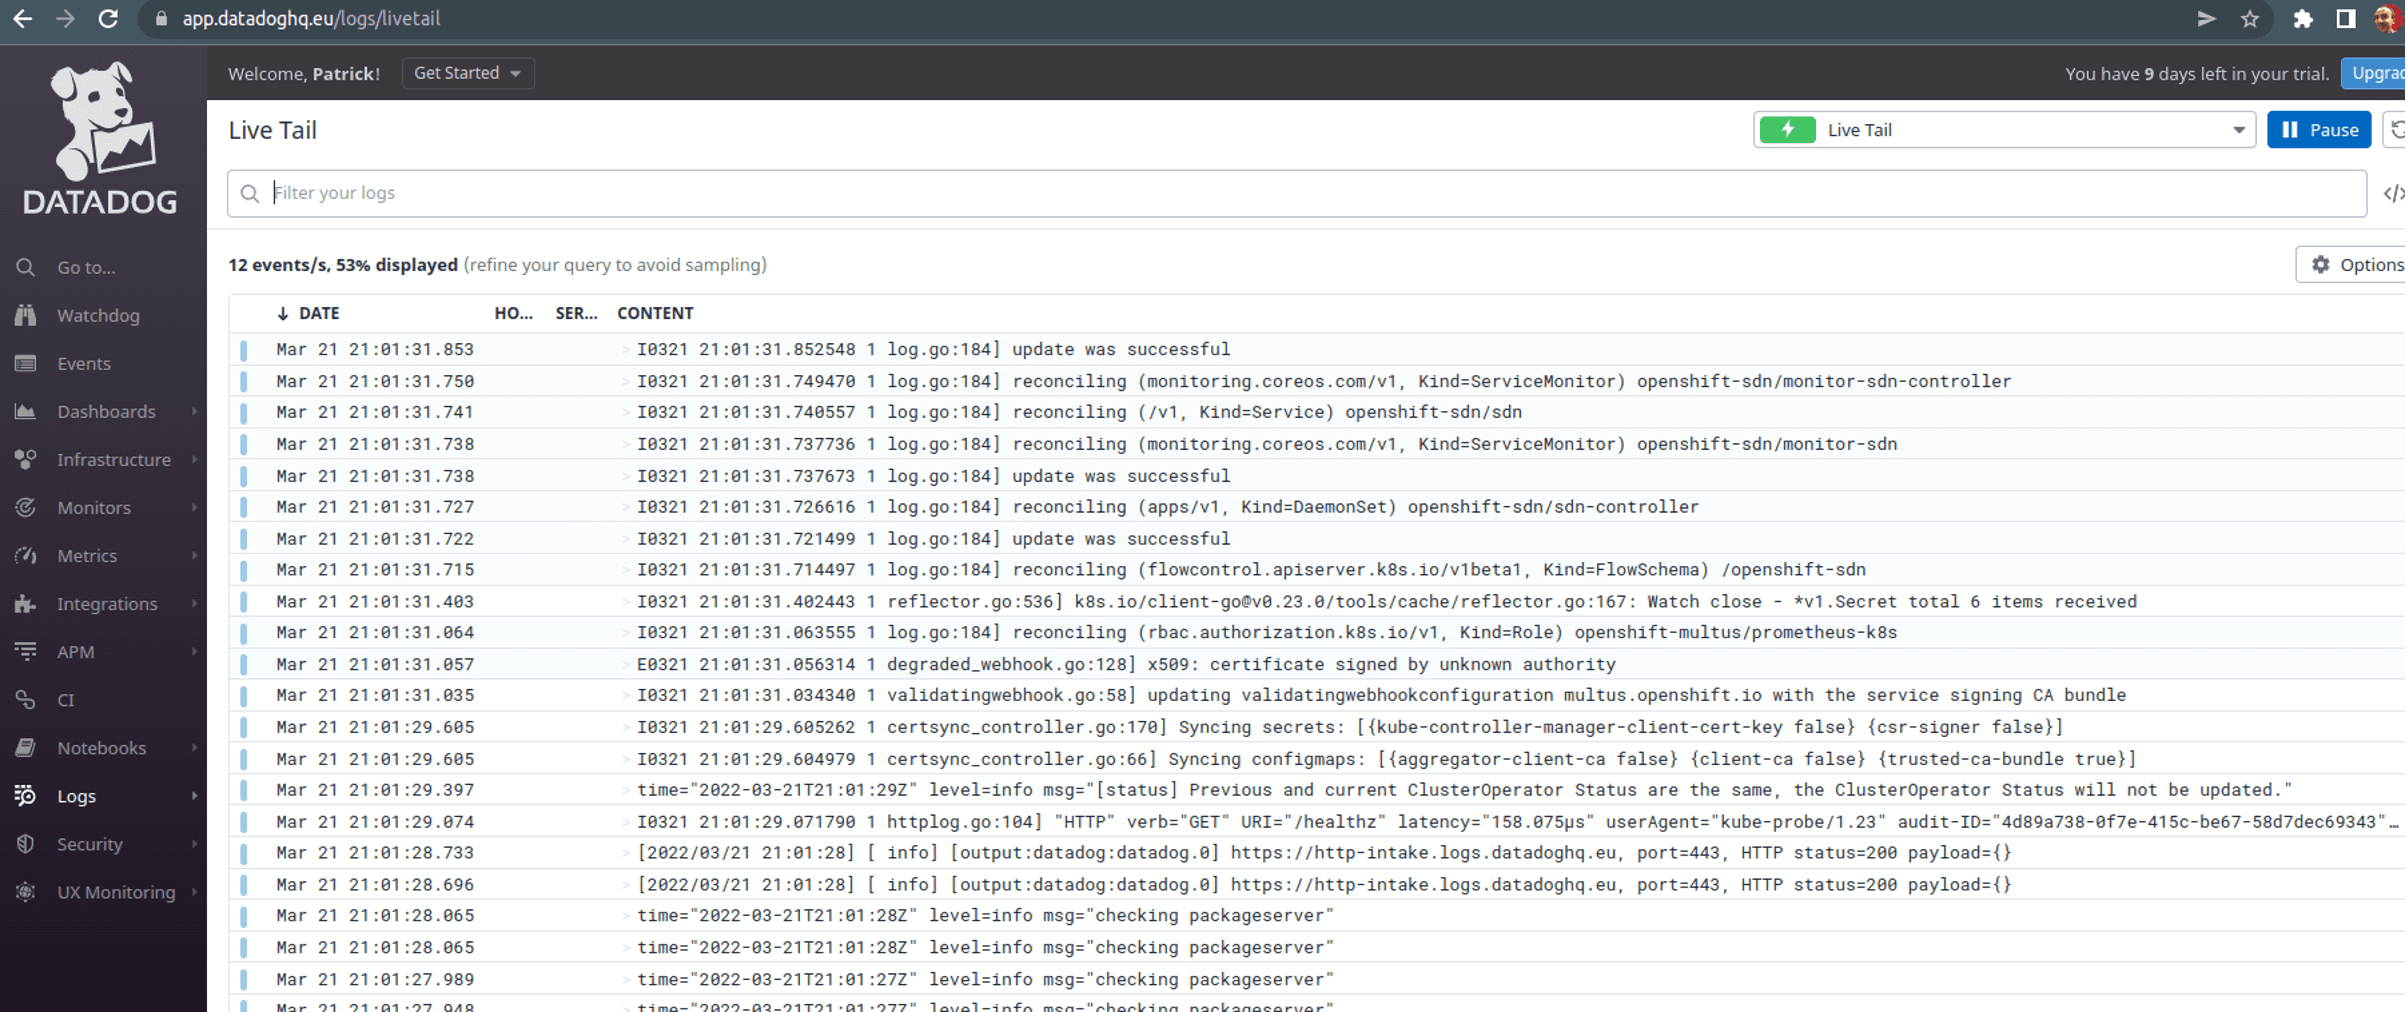
dd_tags $DATADOG_TAGSNow, if you use the Helm chart to deploy then it should send data to Datadog. You can verify this by checking the pod logs and going to https://app.datadoghq.eu/logs/livetail (in my case as I used the EU region) to see logs live.
Summary
As a vendor-neutral CNCF project, Fluent Bit allows you to target multiple endpoints at the same time . This blog post shows you how to send observability data from OpenShift to Elastic, Datadog and Grafana Cloud platforms which are just a small subset of the possible outputs supported by Fluent Bit. Fluent Bit can also support Splunk, Kafka (input and output), OpenSearch and many others.
As mentioned earlier, the key aspects to cover for any deployment are:
Access to host metrics. (optional)
Configuration of the Fluent Bit output plugin (or plugins) of your choice.
All examples in this article are available in the Github repository as scripted Helm installations for simple usage: https://github.com/calyptia/openshift-fluent-bit-examples
A follow-up post on using Fluentd migration to Fluent Bit for users of the existing logging stack provided by Red Hat will also be available shortly so watch this space!
You might also like
Fluent Bit and Fluentd – a child or a successor?
Fluent Bit may have started as a sibling to Fluentd, but it is fair to say that it has now grown up and is Fluentd's equal. Learn which is right for your needs and how they can be used together.