Building an Observability Pipeline with OpenTelemetry and Fluent Bit
Building an Observability Pipeline with OpenTelemetry and Fluent Bit
An e-commerce company planned a flash sale, and the sudden spike in traffic led to performance issues with the website. The engineering team couldn’t pinpoint the actual root cause and realized that they needed a better way to monitor their applications. After some research, the team decided to implement an observability pipeline.
An observability pipeline is a system that collects, processes, and analyzes data from various sources, including logs, metrics, and traces, to provide insights into the performance and behavior of a distributed system.
With an observability pipeline in place, the company could monitor their applications in real-time, detect anomalies, and troubleshoot issues faster. Further, by integrating the pipeline with their incident management system the company would be able to improve the reliability and availability of their systems too.
Concerns Emerge
While it looked good on paper, the team had multiple questions.
How easy is it to integrate the observability pipeline with the existing systems? An observability pipeline involves integrating multiple tools and systems which is quite complex. The company would need to invest time and resources to ensure that their pipeline is configured correctly.
Is the pipeline scalable? Can it handle the surge in data? Scaling was a bigger issue with implementing the pipeline. Since the applications will generate lots of data, the pipeline needed to be scalable. Was this solution scalable?
How quickly can we troubleshoot? An observability pipeline working along with other applications would introduce complexity. It is important for the company to understand whether the solution would provide better actionable insights or just add more noise and confusion.
These are some common questions that come up while implementing an observability pipeline.
Multiple observability tools and stacks are available. And like everything else, there’s no one size fits all solution. In this post, we’ll discuss implementing an agile observability pipeline using OpenTelemetry and Fluent Bit.
OpenTelemetry
OpenTelemetry is an open-source observability framework that provides a standardized way to collect and transmit telemetry data such as traces, logs, and metrics from your applications and infrastructure. This makes it easier to monitor and troubleshoot your systems, as well as to gain insights into the behavior of your applications.
The OpenTelemetry project was formed with the merger of the OpenCensus and OpenTracing projects, and it provides a common set of APIs, libraries, and tools for collecting and analyzing telemetry data in distributed systems.
Components
OpenTelemetry has multiple components and the major ones are
Instrumentation Libraries: These are language-specific libraries that allow you to instrument your application to collect telemetry data. These are available for Java, Python, and .Net to name a few. OpenTelemetry supports both manual instrumentation where you need to modify your source code and auto instrumentation where instrumentation code is automatically injected.
Collector: The collector receives telemetry data from your application and sends it to the backend for storage & analysis. It can receive data in multiple formats over multiple protocols.
Exporter: The exporter sends telemetry data from the collector to the backend of your choice. OpenTelemetry provides a variety of exporters for backends like Prometheus, and Elasticsearch or you can even write your own exporter.
SDKs: OpenTelemetry also provides SDKs that you can use to build custom instrumentation and exporters for your application.
Read more about OpenTelemetry components.
Fluent Bit
Components of our applications and infrastructure generate different types of logs including application logs and system logs. Since there are multiple data sources generating tons of data, any observability pipeline solution must be capable of dealing with different data sources and formats and must provide flexible routing, as well as be reliable and secure. That’s where Fluent Bit comes in.
Fluent Bit is an open-source, lightweight, and vendor-neutral telemetry pipeline agent for logs, metrics, and traces. It is generally used to collect, process, and route data to backends like Elasticsearch, Kafka, or other systems. It can work with logs, metrics, traces, and any other form of input data. Being lightweight, one can run it on edge devices, embedded devices, and on cloud services as well.
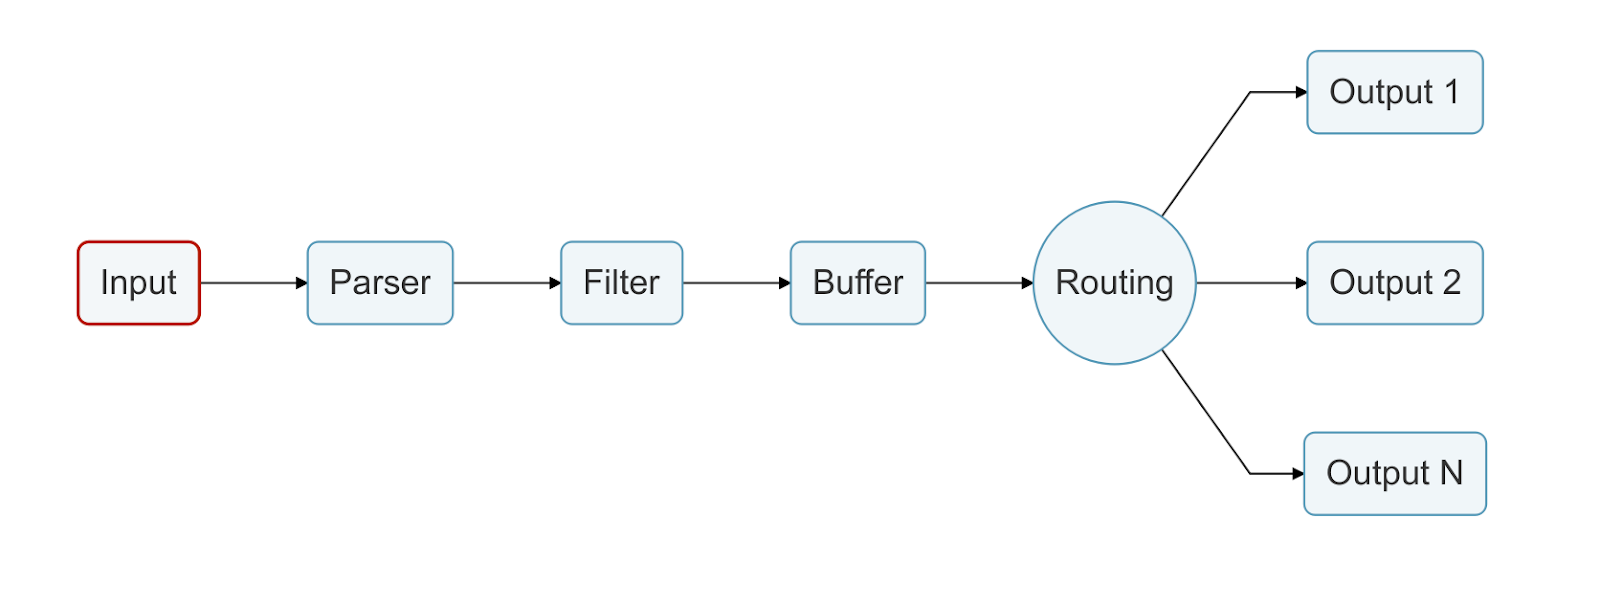
Fluent Bit has multiple components including
Input: Input plugins help collect data from various sources. These support multiple sources like TCP, syslog, HTTP, etc.
Parser: Parser converts the unstructured incoming data to a structured format.
Filter: Filter allows us to alter the parsed data by matching, excluding, or adding metadata to your data.
Buffer: Buffer provides a unified & persistent mechanism to store data. It has mechanisms that can act as backup as well.
Router: The router routes the data through filters to a destination. One can configure the destination using tags and matches.
Output: Output plugins help define the destination for the processed data. There are more than 40 output plugins available currently.
Read more about the components of Fluent Bit.
How does Fluent Bit enable observability pipelines?
Fluent Bit can help enable observability pipelines by providing a simple and efficient way to collect and forward telemetry data. Fluent Bit can be configured to collect data from various sources, including logs, metrics, and traces, and can forward data to various backend systems, allowing developers and operators to gain a comprehensive insight into the behavior and performance of complex systems.
Key features of Fluent Bit
Some of the key features of Fluent Bit that make it a popular tool for enabling an Observability Pipeline are:
Lightweight and Fast – Fluent Bit is designed to be lightweight and fast, making it ideal for processing large amounts of data. The tool is optimized for low CPU and memory usage, allowing it to run efficiently even on low-resource systems.
All-in-One – Fluent Bit supports logs, metrics, and traces, providing a single solution for collecting. processing, and forwarding the so-called three pillars of observability data.
Flexibility – Fluent Bit is highly configurable, providing developers and operators with the flexibility to customize the tool to meet their specific requirements. The tool supports a wide range of inputs and outputs, including file systems, HTTP, TCP, and more.
Scalability – Fluent Bit is designed to be scalable, making it ideal for processing large amounts of data. The tool can be deployed in a distributed architecture, enabling horizontal scaling and load balancing.
Building an OpenTelemetry observability pipeline using Fluent Bit
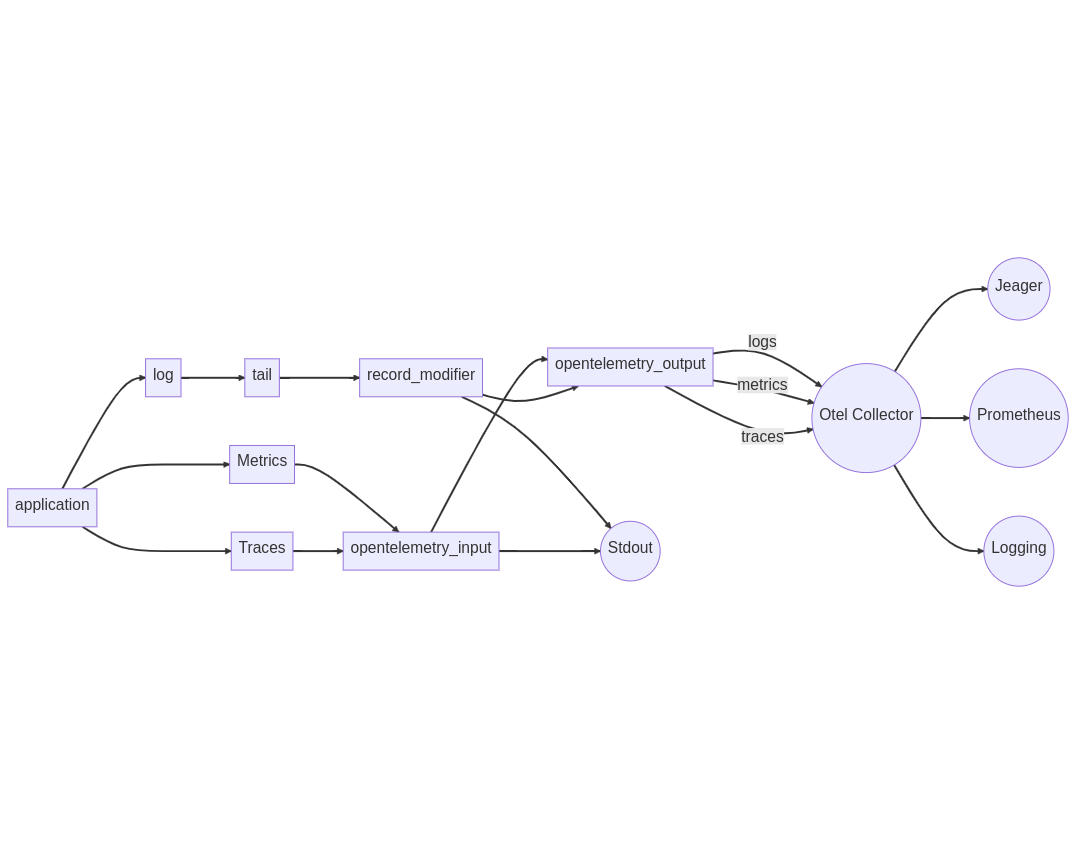
Let us see how we can build an observability pipeline using OpenTelemetry and Fluent Bit for monitoring and analyzing a microservices-based application. Here, the application is instrumented to send metrics, traces, and logs to Fluent Bit, which will be forwarded to Otel Collector and finally to Jaeger and Prometheus.
Prerequisites
For this demo, you will need to have Docker and Docker Compose installed. If you don’t have it already installed, you can follow the install docker-compose official documentation, which has very well-articulated steps. To follow these configuration steps, you can clone the already configured repository available here.
Configuring Fluent Bit
Fluent Bit uses a configuration file to specify its inputs, filters, and outputs. In this case, we will be using the tail input plugin to collect logs from a file and the opentelemetry output plugin to forward the logs to the OpenTelemetry collector.
For Traces and Metrics
Similarly, we will use the HTTP method where our open telemetry plugin will be listening for metrics and traces at /v1/metrics and /v1/traces, respectively.
Here’s an example configuration file for Fluent Bit:
[SERVICE]
	flush 1
	log_level info
[INPUT]
	Name tail
	Path /var/log.log
	Tag demo-app

[FILTER]
	Name record_modifier
	Match demo-app
	Record hostname ${HOSTNAME}

[INPUT]
	name opentelemetry
	host 0.0.0.0
	port 3000
	successful_response_code 200

[OUTPUT]
	Name stdout
	Match *

[OUTPUT]
	Name             	opentelemetry
	Match            	*
	Host             	collector
	Port             	3030
	metrics_uri      /v1/metrics
	logs_uri         	/v1/logs
	traces_uri       	/v1/traces
	Log_response_payload True
	tls              	off
	tls.verify       	off
	# add user-defined labels
	add_label        	app fluent-bit
	add_label        	color blue
This configuration file specifies that Fluent Bit should read logs from the path defined, tag them as demo-app and forward them to OpenTelemetry Collector at http://collector:3030/v1/logs.
The process is similar goes for traces and metrics; instead of forwarding them to the logs endpoint, it forward to /v1/traces and /v1/metrics as defined in the output plugin in configuration.
Setting up OpenTelemetry Collector
OpenTelemetry Collector is a vendor-agnostic agent that can receive, process, and export telemetry data from a variety of sources. Here’s how to set up OpenTelemetry Collector:
Sending logs, metrics, and traces to OpenTelemetry collector
Once you have configured Fluent Bit, you can use it to forward the telemetry data to an OpenTelemetry collector. The OpenTelemetry collector is responsible for collecting and processing telemetry data from different sources and forwarding it to a backend system such as Jaeger or Prometheus. Here is otel-collector configuration yaml; you can read more about receivers, exporters, and processors here
receivers:
  otlp:
	protocols:
  	grpc:
  	http:
    	endpoint: "0.0.0.0:3030"
Visualizing logs in Jaeger and Prometheus
Once you have configured to forward telemetry data to an OpenTelemetry collector, we can export these data and use visualization tools such as Jaeger and Prometheus to view and analyze the data.
Jaeger is a distributed tracing system that can be used to visualize and analyze the performance of microservices-based distributed systems. To visualize logs in Jaeger, you will need to configure the OpenTelemetry collector to forward trace data to Jaeger. You can then use the Jaeger UI to view and analyze the traces.
exporters:
  otlp:
	# disable tls
	endpoint: "jaeger:4317"
	tls:
  	insecure: true
  logging:
  prometheus:
	endpoint: "0.0.0.0:8889"
Prometheus is a time-series database and monitoring system that can be used to visualize and analyze metrics data. To visualize logs in Prometheus, we will need to configure the OpenTelemetry collector to forward metrics data to Prometheus. Lastly, we need to configure Prometheus to scrape data from the exported endpoint.
global:
  scrape_interval: 15s
  evaluation_interval: 15s

scrape_configs:
  - job_name: demo
	scrape_interval: 5s
	static_configs:
  	- targets: ['collector:8889']
Final otel collector yaml will look like:
receivers:
  otlp:
	protocols:
  	grpc:
  	http:
    	endpoint: "0.0.0.0:3030"
exporters:
  otlp:
	# disable tls
	endpoint: "jaeger:4317"
	tls:
  	insecure: true
  logging:
  prometheus:
	endpoint: "0.0.0.0:8889"
service:
  pipelines:
	logs:
  	receivers: [otlp]
  	exporters: [logging]
	traces:
  	receivers: [otlp]
  	exporters: [logging, otlp]
	metrics:
  	receivers: [otlp]
  	exporters: [logging, prometheus]
Start your observability pipeline
To start the local instances of services, run the following command in the cloned repository.
$ docker-compose up --buildExample output:
(venv) ➜  fluent-bit-otel git:(master) ✗ docker compose up --build
[+] Building 2.1s (12/12) FINISHED
 => [internal] load build definition from dockerfile                                                                                                                 	0.0s
 => => transferring dockerfile: 279B                                                                                                                                 	0.0s
 => [internal] load .dockerignore                                                                                                                                    	0.0s
 => => transferring context: 2B                                                                                                                                      	0.0s
 => [internal] load metadata for docker.io/library/python:3.8-slim-buster                                                                                            	2.0s
 => [auth] library/python:pull token for registry-1.docker.io                                                                                                        	0.0s
 => [1/6] FROM docker.io/library/python:[email protected]:f2199258d29ec06b8bcd3ddcf93615cdc8210d18a942a56b1a488136074123f3                                      	0.0s
 => [internal] load build context                                                                                                                                    	0.0s
 => => transferring context: 64B                                                                                                                                     	0.0s
 => CACHED [2/6] WORKDIR /app                                                                                                                                        	0.0s
 => CACHED [3/6] COPY requirements.txt .                                                                                                                             	0.0s
 => CACHED [4/6] RUN pip install -r requirements.txt                                                                                                                 	0.0s
 => CACHED [5/6] RUN apt-get update && apt-get install -y curl                                                                                                       	0.0s
 => CACHED [6/6] COPY app.py .                                                                                                                                       	0.0s
 => exporting to image                                                                                                                                               	0.0s
 => => exporting layers                                                                                                                                              	0.0s
 => => writing image sha256:613c0c77e65b1e512ba269a3745072e85e4f55bae7054d34e25d7f549a9b0bf7                                                                         	0.0s
 => => naming to docker.io/library/fluent-bit-otel-app                                                                                                               	0.0s

Use 'docker scan' to run Snyk tests against images to find vulnerabilities and learn how to fix them
[+] Running 6/5
 ⠿ Network fluent-bit-otel_default     	Created                                                                                                                   	0.1s
 ⠿ Container fluent-bit-otel-prometheus-1  Created                                                                                                                   	0.0s
 ⠿ Container fluent-bit-otel-jaeger-1  	Created                                                                                                                   	0.1s
 ⠿ Container fluent-bit-otel-collector-1   Created                                                                                                                   	0.0s
 ⠿ Container fluent-bit-otel-fluentbit-1   Created                                                                                                                   	0.0s
 ⠿ Container fluent-bit-otel-app-1     	Created                                                                                                                   	0.0s
Generate Traces
To generate traces run the following command in terminal
curl -X GET http://localhost:5000/generateVerify the pipeline
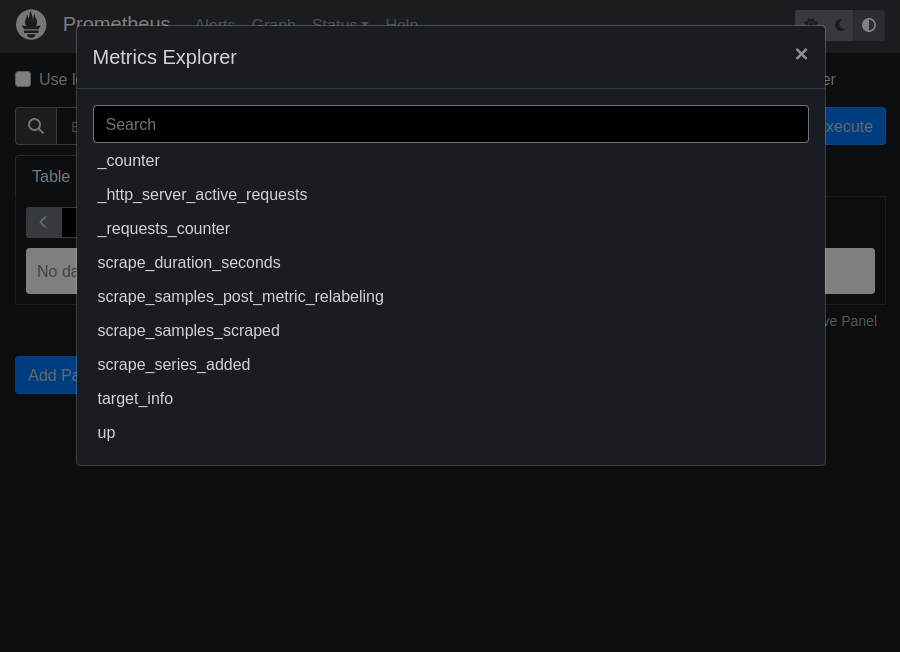
Metrics on Prometheus
Traces on Jeager
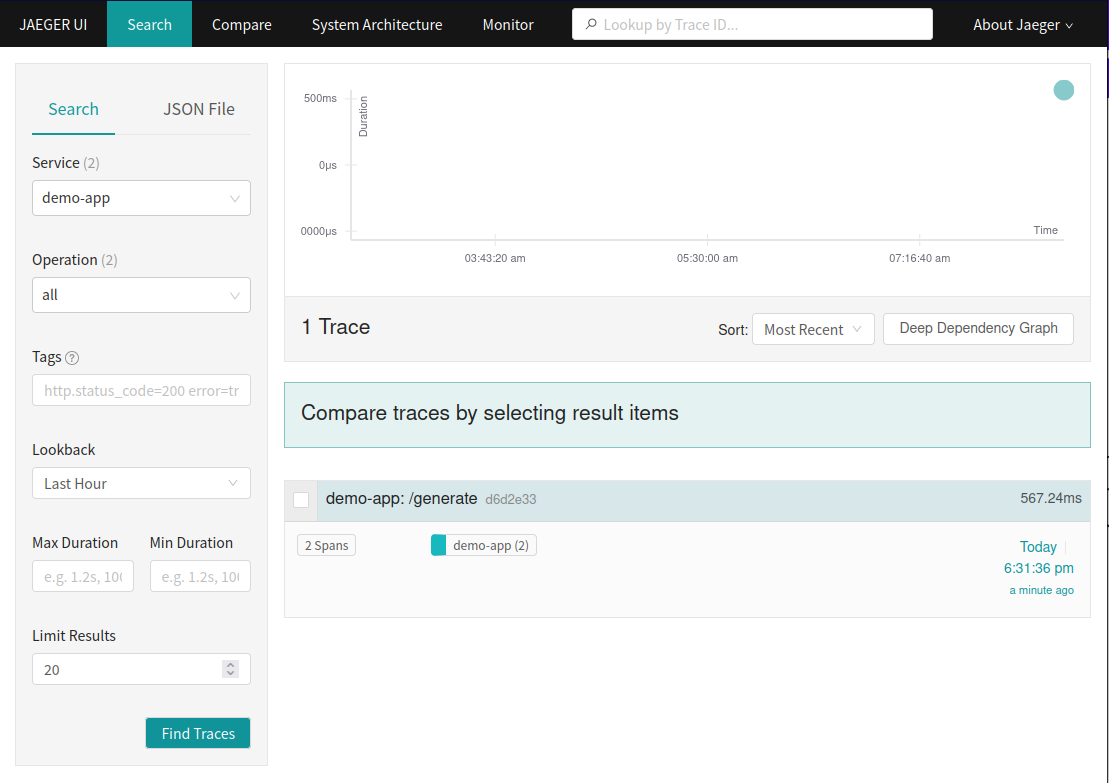
Logs on console
In the above screenshot, we can see the logs are generated when we hit the generate traces endpoint, and those logs are being collected by Fluent Bit and forwarded to the Otel Collector.
Use cases of OpenTelemetry and Fluent Bit integration
OpenTelemetry and Fluent Bit integration can be used in a wide range of use cases, including centralized logging, application performance monitoring, and distributed tracing. Let’s dive deeper into each of these use cases.
Centralized logging
Centralized logging involves collecting, aggregating, and analyzing logs from multiple sources in a central location. This allows you to monitor the behavior and performance of your entire system in one place, making it easier to detect and diagnose issues.
By integrating Fluent Bit with OpenTelemetry, you can collect and process logs from multiple sources, and forward them to a centralized logging system such as Elasticsearch or Splunk. This enables you to quickly search and analyze logs from multiple sources, and identify patterns and trends that can help you optimize performance and troubleshoot issues.
Application performance monitoring
Application performance monitoring (APM) involves collecting and analyzing telemetry data such as logs, metrics, and traces to monitor the performance of your applications. APM tools can provide insights into the behavior and performance of your applications, allowing you to identify performance bottlenecks, optimize resource utilization, and troubleshoot issues.
By integrating Fluent Bit with OpenTelemetry, you can collect and process telemetry data from multiple sources, and forward it to an APM tool such as Datadog or New Relic. This enables you to monitor the performance of your applications in real-time and identify and diagnose issues quickly.
Distributed tracing
Distributed tracing involves tracking the flow of requests through a distributed system, and collecting telemetry data such as traces and spans to monitor the performance and behavior of the system. Distributed tracing can help you identify performance bottlenecks, optimize resource utilization, and troubleshoot issues in distributed systems.
By integrating Fluent Bit with OpenTelemetry, you can collect and process telemetry data such as traces and spans and forward it to a distributed tracing system such as Jaeger or Zipkin. This enables you to track the flow of requests through your distributed system and analyze the performance and behavior of your system in real-time.
Conclusion
In conclusion, the OpenTelemetry observability pipeline using Fluent Bit offers a highly efficient and flexible solution for observability needs. One of its key advantages is multiple plugins available for all possible data sources and destinations without having to install new agents and exporters into a single pipeline, this simplifies the observability architecture. Moreover, the pipeline is highly customizable, enabling users to easily add new sources and destinations as needed, without requiring a major overhaul of the entire system. This feature can be especially valuable for organizations that are constantly evolving and need to adapt their observability tools accordingly. Additionally, the all-in-one support for traces, logs, and metrics provided by
Fluent Bit simplifies the management of data streams, reducing the complexity of the observability pipeline. Overall, the OpenTelemetry observability pipeline using Fluent Bit is a versatile and efficient solution that can help organizations to gain valuable insights into their applications, without being locked into a single vendor or facing difficulties in scaling or complexity.
How Calyptia can help
As the creators and maintainers of Fluent Bit, Calyptia simplifies observability with Fluent Bit-based products and services. Fluent Bit provides a vendor-neutral solution for your telemetry pipeline. With Fluent Bit as your agent, your data moves seamlessly from the systems producing it to your chosen storage and analytical backends. Whether those backends are open source or proprietary commercial solutions, to Fluent Bit it doesn’t matter. And should you decide to add or change backends, with Fluent Bit as your telemetry pipeline agent it’s a simple configuration change, no need to deploy new agents.
Calyptia Core, our enterprise product, provides a click-and-drag approach to telemetry pipeline management and configuration with Fluent Bit under the hood. It lets you easily apply in-stream processing filters that eliminate noisy data, redact sensitive data, and more before the data is delivered to storage and analytic solutions. This in-flight processing reduces risk and reins in out-of-control data storage and analysis costs. Calyptia Core provides all the benefits of Fluent Bit and adds ease of management.
Talk to us today to learn how Calyptia can simplify your observability journey.
You might also like

Statement on CVE-2024-4323 and its fix
We'd like to make sure you’re aware of a security vulnerability (known as CVE-2024-4323) that impacts Fluent Bit versions 2.0.7 through 3.0.3. The latest version of Fluent Bit, version 3.0.4, fixes this issue.