
Powering Custom Metric Collection in On-Prem Apps with Fluent Bit
Powering Custom Metric Collection in On-Prem Apps with Fluent Bit
Managing and monitoring software applications and infrastructure can be a daunting task, especially during periods of increased usage. Recently, an e-commerce company was gearing up for an upcoming festive season, and their on-premises application’s critical component was the order management system. The system was responsible for handling a sudden influx of orders during the festive sales.
However, during this time, the team noticed that the application was struggling to handle the sudden spike in traffic and was frequently down, causing frustration among customers and resulting in a loss of revenue for the business owners.
Upon investigating, the IT team found that their existing monitoring system was not up to the task, prompting them to work on an alternate monitoring solution.
In this blog post, we’ll delve into the prototype the team proposed, showcasing how they built a robust monitoring pipeline using Fluent Bit, Prometheus, and New Relic, their existing monitoring tool in place.
ToDo Prototype
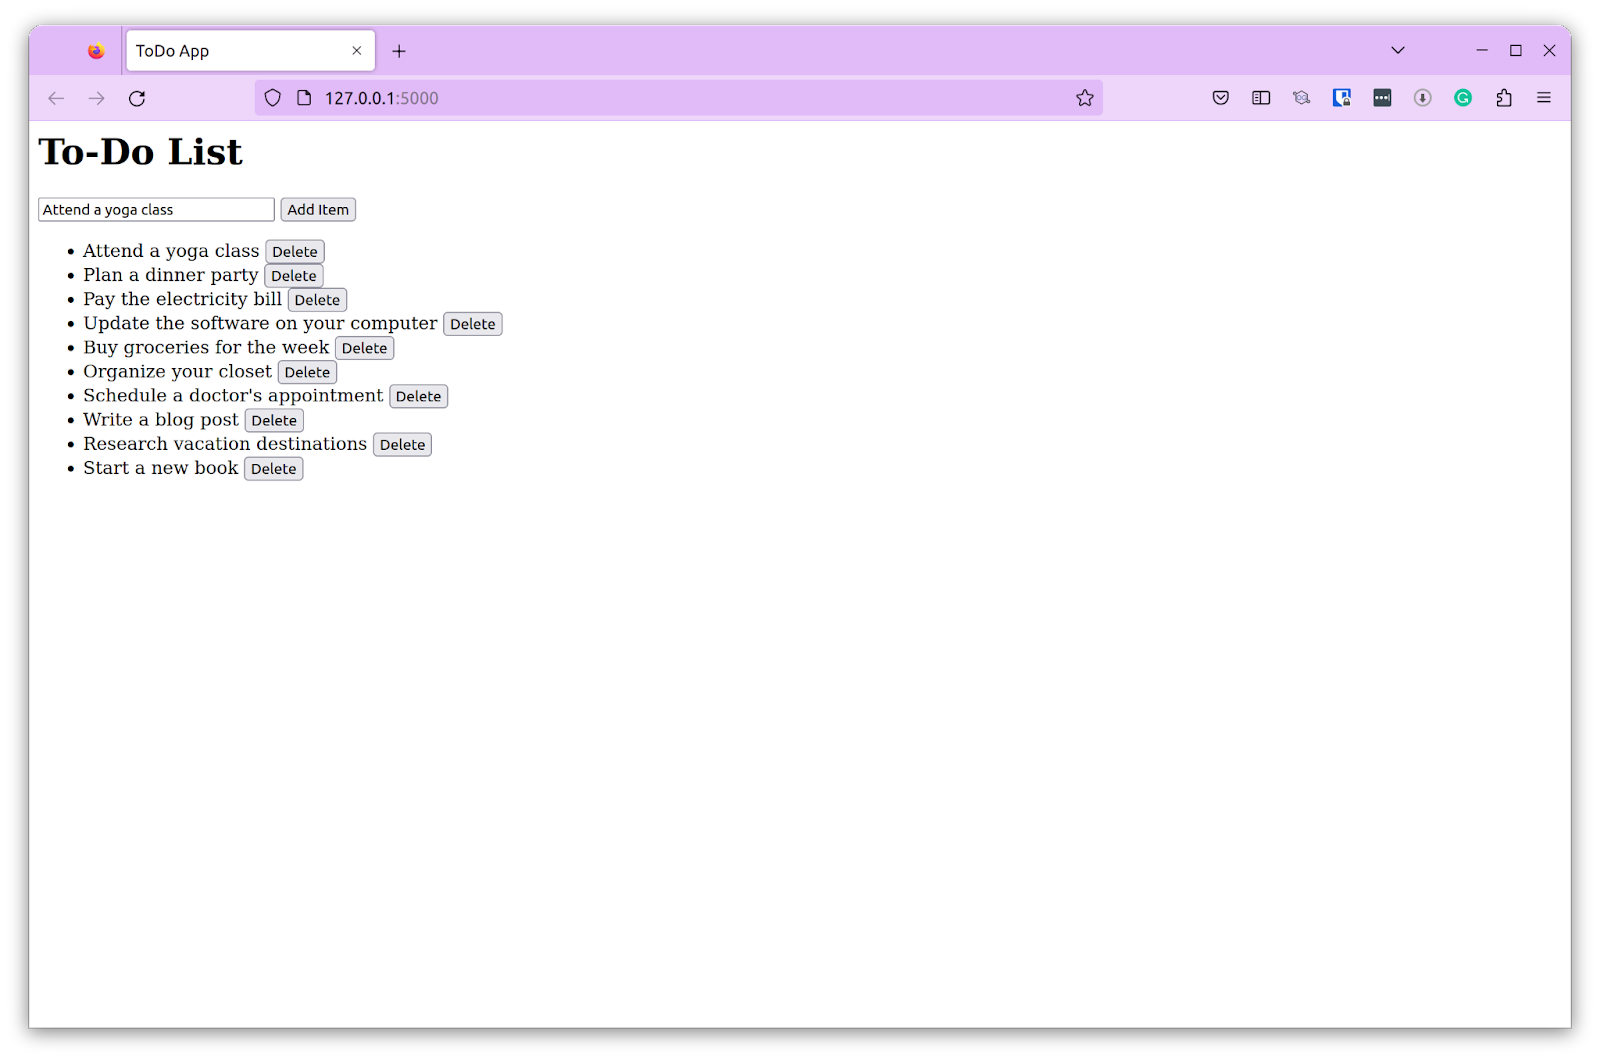
The prototype that we’ll be working on will be a simple ToDo application written in Python using Flask. The application runs on an Ubuntu machine which has Fluent Bit running as a service. Fluent Bit’s Prometheus scrape input plugin is used and the output is Prometheus remote write.
To add custom metrics to this application, we’ll use Promethues’s Python SDK. Custom metrics like request count and time are added to the application. The Prometheus SDK also configures a metrics endpoint where the metrics will be pushed. These metrics are then pushed to New Relic using their Prometheus remote write plugin, and the metrics can be visualized on New Relic.
Prerequisites
Having understood the prototype that we’ll work on, there are a few prerequisites.
Fluent Bit For Ubuntu – you can choose a different version based on your environment.
Redis Server – the ToDo application uses Redis to store the ToDo items
New Relic account – Register for a free New Relic account if you don’t already have one
Setup
The sample application is in this GitHub Repo. You can start by cloning this repo and setup the application.
ToDo Application
Let’s look into the sample ToDo application to understand what it does.
Import prometheus_client and Redis. Also, configure it to connect to the Redis server at the specific host and port.
from prometheus_client import Summary, make_wsgi_app, Gauge
from redis import Redis

redis = Redis(host='localhost', port=7777, db=0)
Create Prometheus metrics, read more about Prometheus metric types
REQUEST_TIME_LIST = Summary('request_time_list', 'Time spent for LIST request')
REQUEST_TIME_ADD = Summary('request_time_add', 'Time spent for ADD request')
REQUEST_TIME_REMOVE = Summary('request_time_remove', 'Time spent for DELETE request')
REQUEST_ADD_COUNT = Gauge('request_add_count', ' No. of Requests to add items')
REQUEST_REMOVE_COUNT = Gauge('request_remove_count', 'No. of Requests to remove items')
Decorate a function with the Prometheus metric and add them wherever necessary.
@REQUEST_TIME_ADD.time()
@app.route('/add', methods=['POST'])
def add_todo_item():
item = request.json['item']
redis.set(item, item)
REQUEST_ADD_COUNT.inc()
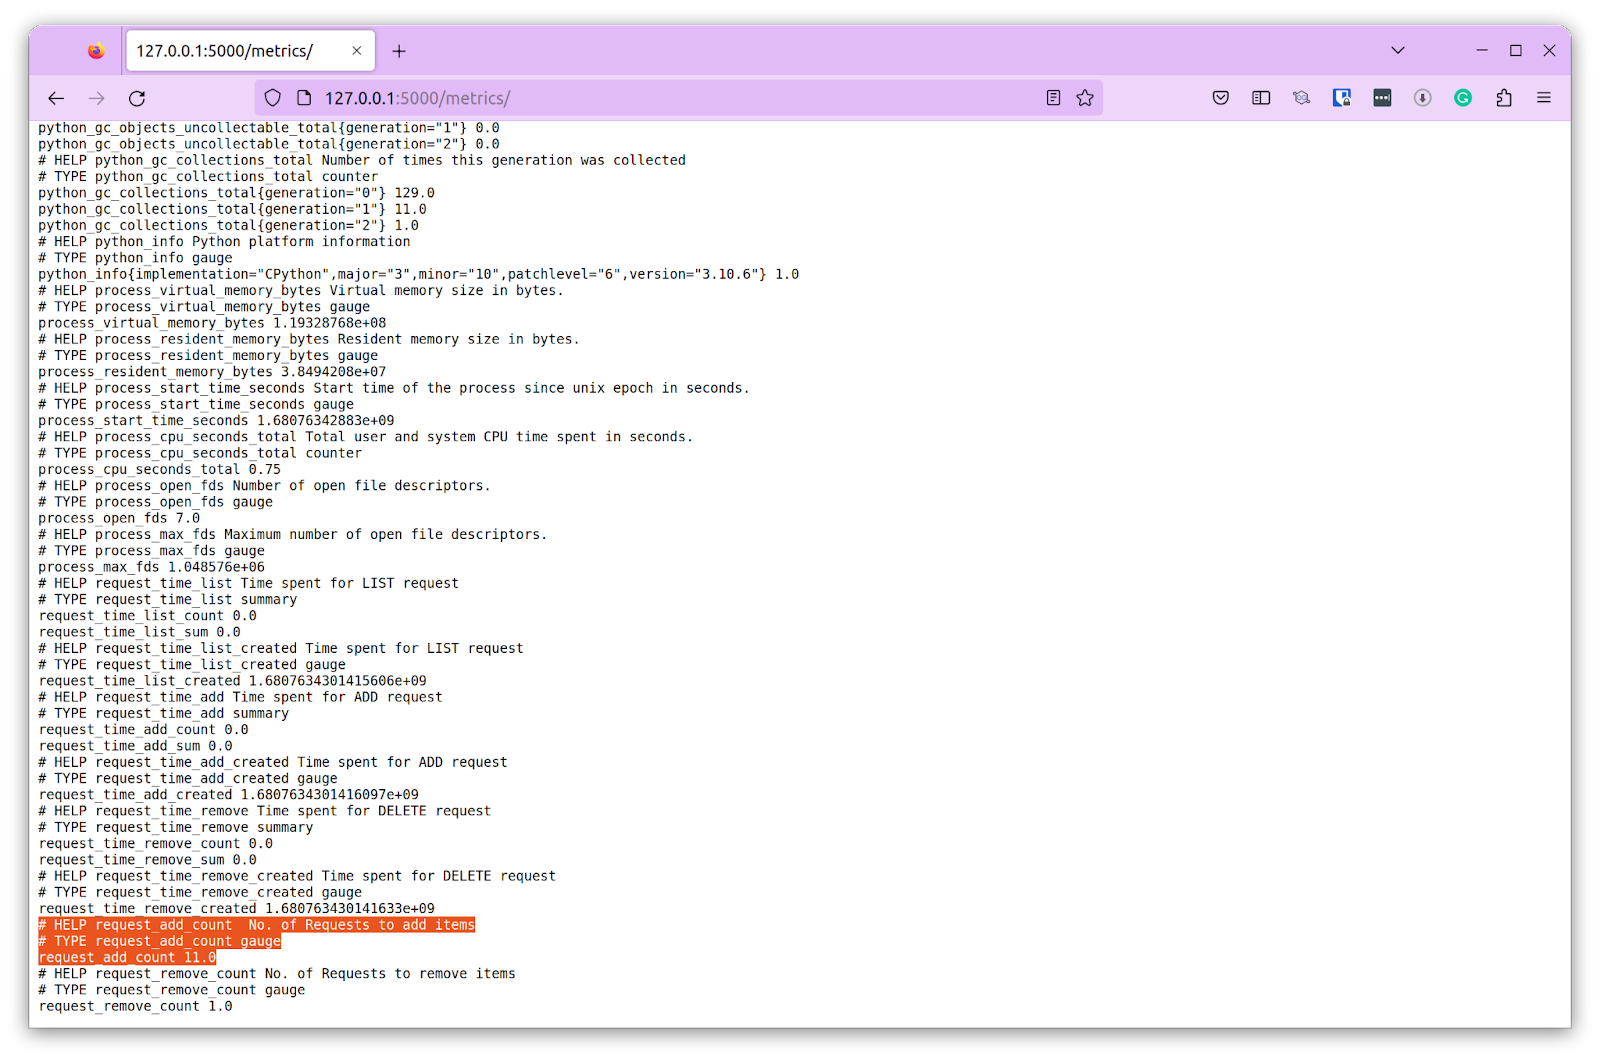
return jsonify({'success': True})Lastly, you need to configure the metrics endpoint; this way you can access the metrics at http://127.0.0.1:5000/metrics
app.wsgi_app = DispatcherMiddleware(app.wsgi_app, {
	'/metrics': make_wsgi_app()
})
Run the application and you can access it at http://127.0.0.1:5000. Make sure to run your redis-server on port 7777 as configured in the application.
Fluent Bit Configuration
Since this application is running on Ubuntu, we have configured Fluent Bit to run as a service. There are two things that we need to configure here: the plugins and Fluent Bit’s default configuration.
To use New Relic, we need to use the New Relic output plugin, and for that, you need to download and install the plugin. Download the plugin and update Fluent Bit’s plugin configuration file.
[PLUGINS]
	# Path /path/to/out_gstdout.so
	/home/user/Documents/fluentbit/out_newrelic-linux-amd64-1.14.2.so
The next step is to configure the INPUT and OUTPUT plugins in the Fluent Bit configuration file. On Ubuntu, you can find it under /etc/fluent-bit/.
As mentioned earlier, we’ll use prometheus_scrape INPUT plugin to collect metrics from our ToDo application. As for the OUTPUT plugin, we use promethus_remote_write to send the metrics to New Relic.
[INPUT]
	name prometheus_scrape
	host 127.0.0.1
	port 5000
	tag todo_app
	metrics_path /metrics
	scrape_interval 2s

[OUTPUT]
	name  stdout
	match *

[OUTPUT]
	Name prometheus_remote_write
	Match *
	Host metric-api.newrelic.com
	Port 443
	Uri /prometheus/v1/write?prometheus_server=todo-app
	Header Authorization Bearer
	Log_response_payload True
	Tls              	On
	Tls.verify       	On
After you have the configurations done, you can restart the fluent-bit service
sudo systemctl restart fluent-bit
sudo systemctl status fluent-bit
● fluent-bit.service - Fluent Bit
 	Loaded: loaded (/lib/systemd/system/fluent-bit.service; disabled; vendor preset: enabled)
 	Active: active (running) since Thu 2023-04-06 12:17:17 IST; 1min 15s ago
   	Docs: https://docs.fluentbit.io/manual/
   Main PID: 70474 (fluent-bit)
  	Tasks: 6 (limit: 17681)
 	Memory: 12.7M
    	CPU: 60ms
 	CGroup: /system.slice/fluent-bit.service
         	└─70474 /opt/fluent-bit/bin/fluent-bit -c //etc/fluent-bit/fluent-bit.conf

Apr 06 12:18:31 my-user fluent-bit[70474]: 2023-04-06T06:48:30.947820484Z process_max_fds = 1048576
Apr 06 12:18:31 my-user fluent-bit[70474]: 2023-04-06T06:48:30.947820484Z request_time_list_created = 1680763430.1415606
Apr 06 12:18:31 my-user fluent-bit[70474]: 2023-04-06T06:48:30.947820484Z request_time_add_created = 1680763430.1416097
Apr 06 12:18:31 my-user fluent-bit[70474]: 2023-04-06T06:48:30.947820484Z request_time_remove_created = 1680763430.141633
Apr 06 12:18:31 my-user fluent-bit[70474]: 2023-04-06T06:48:30.947820484Z request_add_count = 10
Apr 06 12:18:31 my-user fluent-bit[70474]: 2023-04-06T06:48:30.947820484Z request_remove_count = 1
Apr 06 12:18:31 my-user fluent-bit[70474]: 2023-04-06T06:48:30.947820484Z request_time_list = { quantiles = { }, sum=0, count=0 }
Apr 06 12:18:31 my-user fluent-bit[70474]: 2023-04-06T06:48:30.947820484Z request_time_add = { quantiles = { }, sum=0, count=0 }
Apr 06 12:18:31 my-user fluent-bit[70474]: 2023-04-06T06:48:30.947820484Z request_time_remove = { quantiles = { }, sum=0, count=0 }
Apr 06 12:18:32 my-user fluent-bit[70474]: [2023/04/06 12:18:32] [error] [input:prometheus_scrape:prometheus_scrape.0] empty response
At this point, your application is running, it’s generating metrics which is pushed to /metrics endpoint. Let us now configure the New Relic account to receive these metrics and visualize them.
New Relic
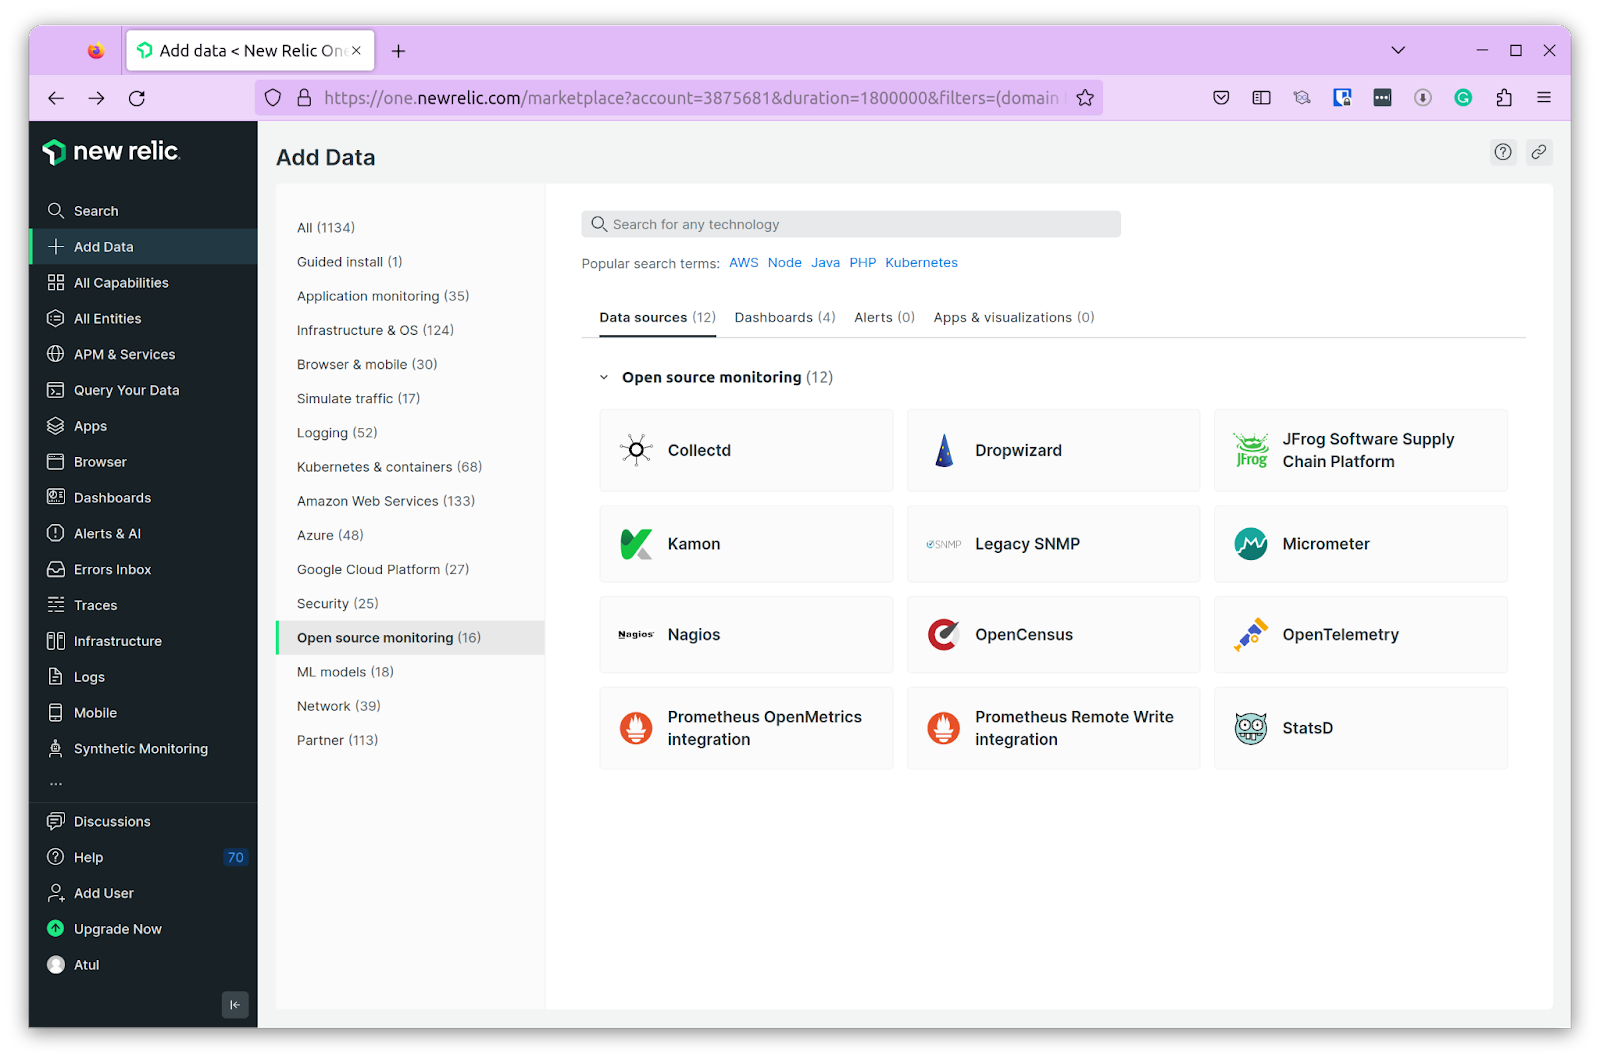
Login to your New Relic account and navigate to Add Data option. Choose Open Source Monitoring, and look for Prometheus Remote Write integration.
Since we have already configured our Fluent Bit with prometheus_remote_write, we don’t need to set it up. You can skip the installation and click on the See your data button.
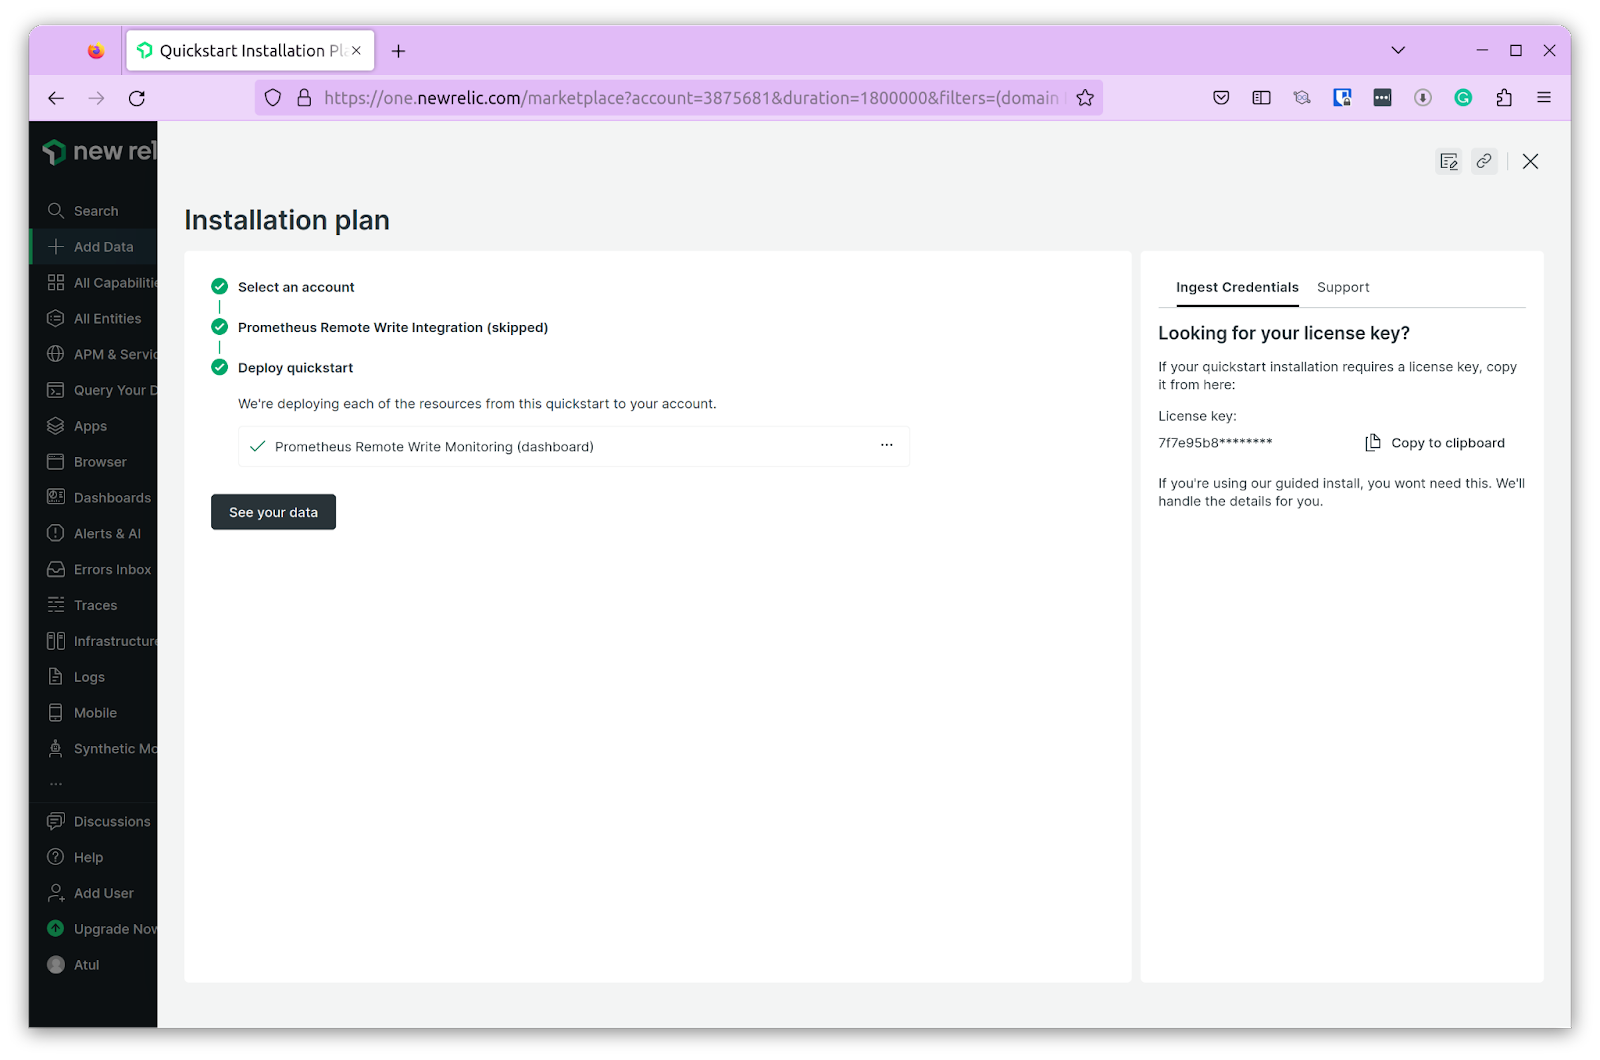
You will be presented with a dashboard that shows visualizations using the metrics that are pushed from our ToDo application.
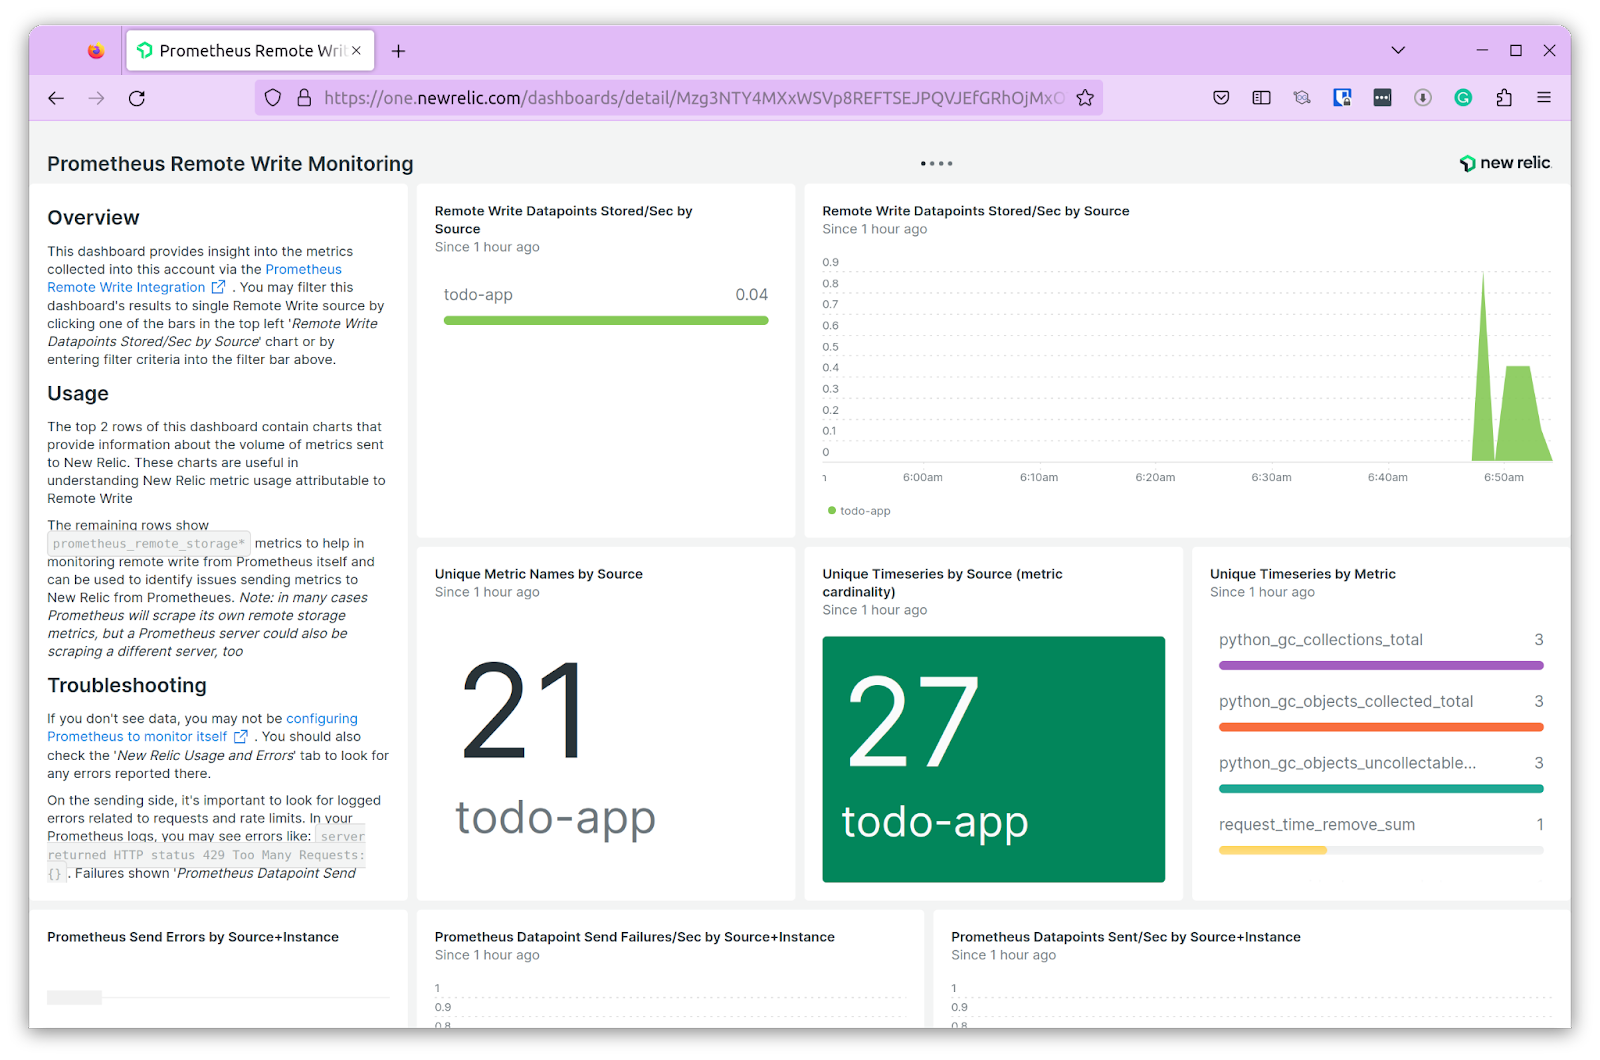
This is how, by leveraging the power of Fluent Bit, Prometheus, and New Relic, the team was able to build a robust monitoring pipeline that helped them collect metrics for their application and infrastructure.
Summary
In conclusion, metrics collection is an essential aspect of observability for any software application, be it on-premises or cloud-based. Our use case study of logging metrics for an on-premises application using Fluent Bit has shown that while building a monitoring pipeline manually can be a challenging task, it is a critical one for detecting and resolving issues before they lead to downtime.
However, with configuration issues prone to errors, the process can be time-consuming and frustrating. To address these challenges, we recommend using a tool like Calyptia Core that provides an easy-to-use drag-and-drop interface, allowing for quick and error-free pipeline setup. Calyptia was founded by the creator of Fluent Bit and Core is powered by Fluent Bit.
By using a tool like Calyptia, teams can reduce the scope of error in pipeline setup and accelerate the monitoring setup process, ultimately leading to more reliable and resilient software applications. So why not give it a try today?
You might also like

A practical guide for avoiding data loss and backpressure problems with Fluent Bit
Learn how to detect and avoid backpressure problems with Fluent Bit by balancing memory-based and filesystem-based buffering.