
Getting Started with Monitoring: Fluent Bit and Prometheus Metrics 101
Getting Started with Monitoring: Fluent Bit and Prometheus Metrics 101
Today, most businesses rely on their online presence. Hence, it’s crucial that their applications are always up and running. But we all know that even the best infrastructure can run into unexpected issues affecting the availability of the application.
For any server administrator, ensuring that the application is always up is key. Imagine that your marketing team recently executed an ad campaign that resulted in an instant rise in the number of visitors. However, your application wasn’t ready for the surge and the extra traffic crashed your site.
But what if you knew what was happening with your application beforehand?
That’s where software observability comes in. It helps you collect metrics, logs, and traces from your infrastructure and application that you can use to make decisions. Back in the day, implementing observability was difficult due to the lack of tools and technologies. Things are different today.
There is an array of proprietary and open source observability tools available that you can use to implement observability in your apps and infrastructure. In this blog post, we’ll show you one such tool–Fluent Bit–and how it makes implementing observability easy.
What is Fluent Bit?
Fluent Bit is an open-source solution for efficiently collecting, processing, and routing large volumes of telemetry data. With its lightweight design and extensible architecture, Fluent Bit is one of the popular choices for organizations looking to gain real-time insights into their systems’ performance, troubleshoot issues, and improve overall observability.
Fluent Bit offers the following benefits:
Lightweight and fast: It has a footprint of ~450kb and thus requires fewer system resources & still runs faster than other agents.
Open Source: Fluent Bit is a CNCF graduated project with over 4400 stars on GitHub.
Multi-platform support: Linux, Mac, or Windows, Fluent Bit can run on any platform. It also seamlessly works with tools like Kubernetes
One Agent For All: Fluent Bit has a single agent that allows you to collect logs from multiple sources and forward them to other sources.
You can refer to the Fluent Bit documentation to understand more about how it works. You can also refer to our blog post on how to send logs to Loki using Fluent Bit
Metrics Collection Using Fluent Bit and Prometheus
By design Fluent Bit allows you to collect logs from multiple sources and forward them to various destinations. For instance, you can scrape Prometheus-based logs and forward them to Grafana or collect node metrics from a server and push it to Kafka.
In this section, we’ll show you how you can use Fluent Bit with Prometheus for metrics collection and analysis. We will configure Fluent Bit to collect node metrics from a Linux machine and forward it to Grafana for analysis. We will be configuring everything on a local Kubernetes cluster. Let’s see how it is done.
Pre-requisites
Kubernetes cluster – we are using Minikube local cluster; you can use any Kubernetes cluster.
Install Prometheus and Grafana on the cluster. You can install them using HELM charts – Prometheus & Grafana
Note: Prometheus comes with
prometheus-node-exporterconfigured by default. Hence it will scrape node metrics. However for this blog post, since we are using Fluent Bit’s node_exporter_metrics, we will disableprometheus-node-exporterin values.yaml before installing Prometheus
Fluent Bit configuration
One of the reasons for Fluent Bit’s popularity is the ease of configuration. It allows you to create a data pipeline based on your inputs, filters, and outputs. This allows you to collect, transform and push logs, metrics, and traces from anywhere to anywhere. You can view the complete list of supported Inputs and Outputs.
Input
Since we are going to collect node metrics from the Linux machine, we need to configure Fluent Bit’s input to collect those metrics. In order to do that we will add an [INPUT] block in the configuration file with details as shown below
[INPUT]

    Name node_exporter_metrics
    Tag node_metrics
    Scrape_Interval 2
The above INPUT block configures an Input names node_exporter_metrics to collect node metrics every 2 seconds and add a tag node_metrics.
Output
Now that we have successfully collected the node metrics, we need to forward them to a tool that can ingest them. As mentioned above, we’ll be using Grafana in this case. Add a new [OUTPUT] block in the same configuration file with the details shown below:
[OUTPUT]

    	Name  prometheus_exporter
    	Match node_metrics
    	Host  0.0.0.0
    	Port  2020
Here, the block configures an Output with the name prometheus_exporter along with a match expression as node_metrics along with a host and port. Since we have a Prometheus instance running on the same cluster, we don’t need to change anything here.
Prometheus
At this point, if you visit Prometheus and check if the metrics are coming in, you’ll not find anything. This is because we have not configured a scrape_job in Prometheus that tells it where to scrape the logs from. In order to do so, add the following to the configuration file.
 - job_name: fluent-bit
    	static_configs:
      	- targets:
        	- fluent-bit.default.svc.cluster.local:2020
We are adding a new scrape_job named fluent-bit and setting the target with the service name for the fluent-bit service. With this, Prometheus will now listen to this endpoint for logs and scrape them. Once done, you can navigate to the Prometheus dashboard by exposing the service and accessing the portal.
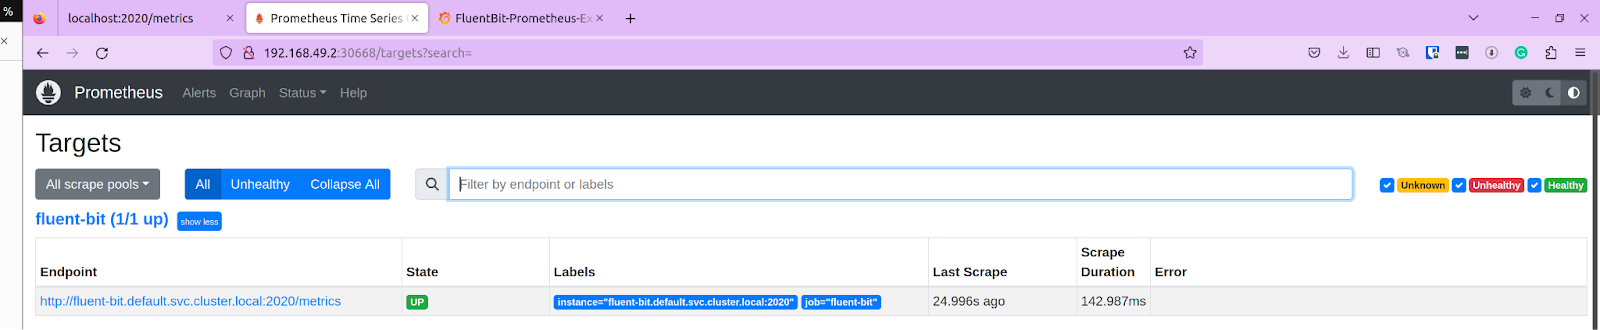
Navigate to Status -> Targets, and you should see our fluent-bit endpoint listed with the status as Up. At this point, we have successfully configured Fluent Bit to collect node metrics and push them to a Prometheus endpoint.
Grafana
Since we now have our logs in Prometheus, we will now configure Grafana to collect those metrics and create a dashboard to visualize the data.
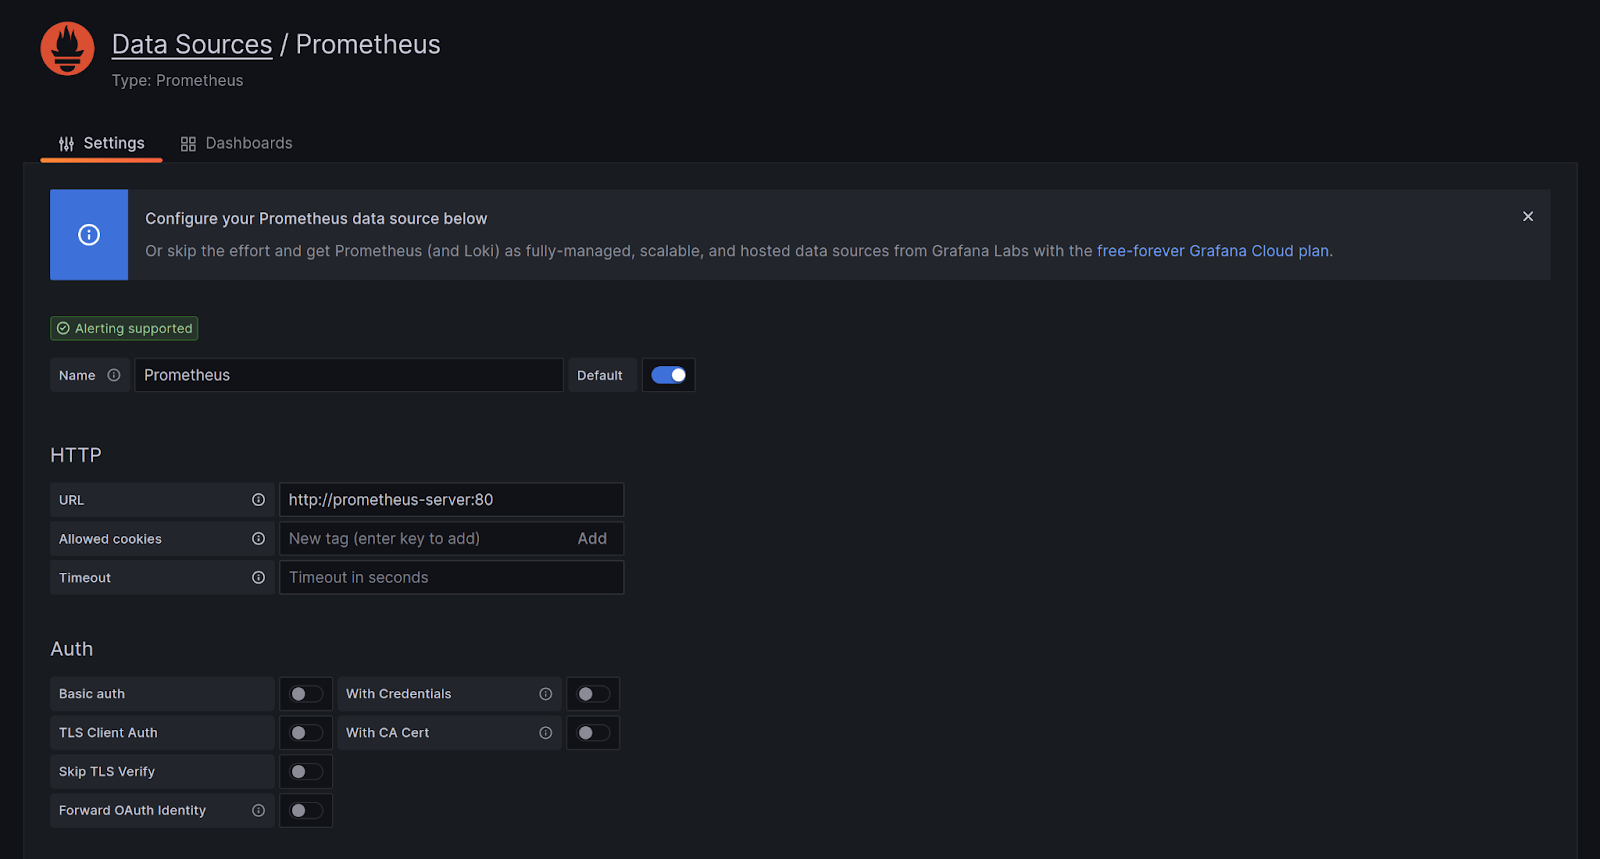
The first step is to configure a data source. Access your Grafana dashboard by exposing the service. Navigate to Settings -> Data Sources and set up a new data source. From the list choose Prometheus. On the next page, provide the endpoint as http://prometheus-server:80 (or the name of your Prometheus service.) Click on Test, and it should be successful.
Once it is successful, you can create a dashboard using this data source. Choose metrics and add panels to a dashboard. You can refer to Grafana’s visualization document to learn more about how to create panels & dashboards.
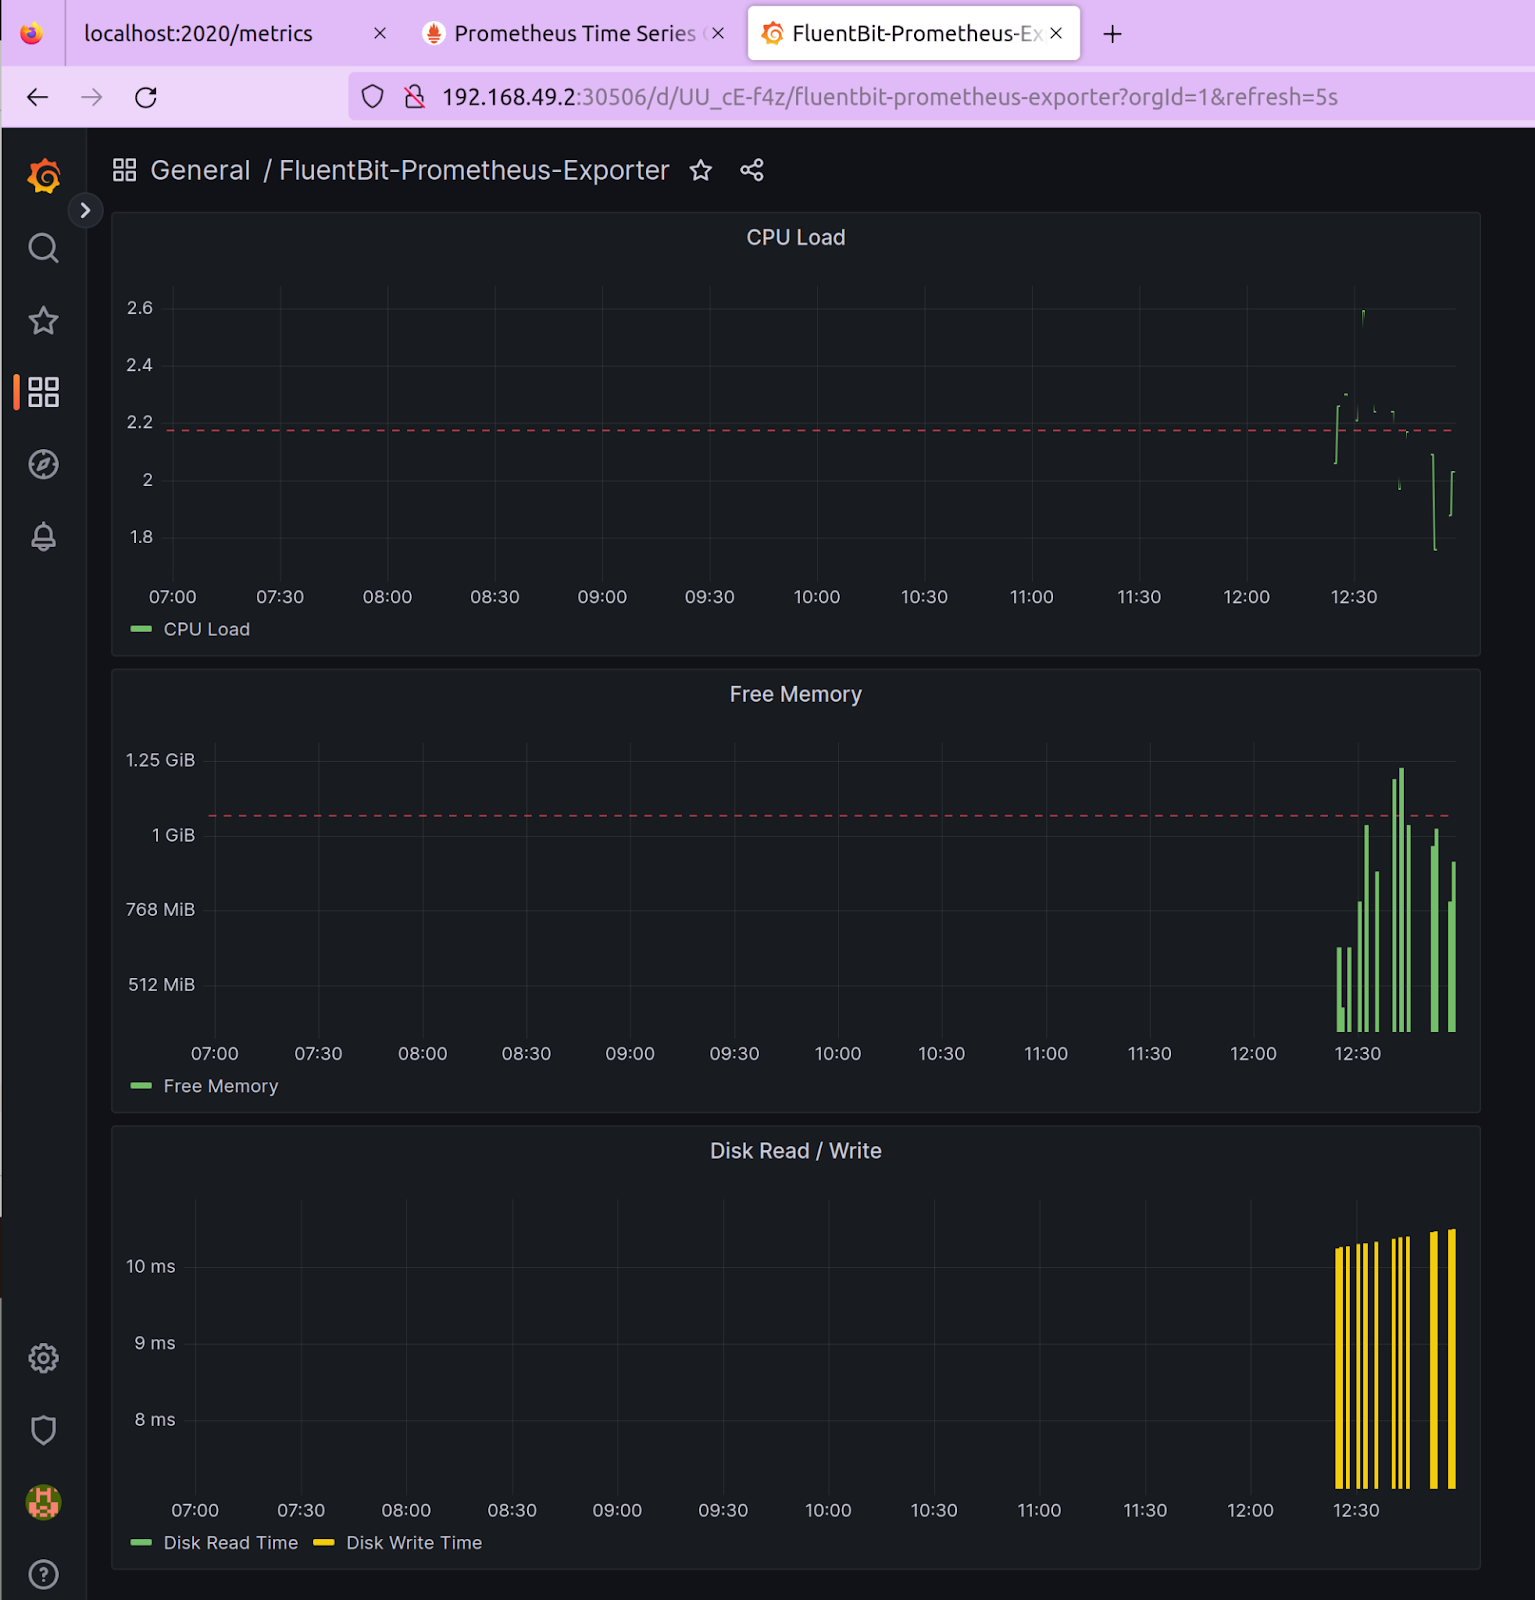
Above is a sample dashboard that we created that shows the CPU load, Free memory, and Data R/W time based on the telemetry data extracted from Prometheus. You can use our dashboard.json file to replicate this dashboard.
You are now able to see the node_metrics that were exported using Fluent Bit, pushed to Prometheus, and visualized in Grafana. That’s about how easy it is to configure an observability pipeline using Fluent Bit.
Summary
To conclude, monitoring is an important aspect of maintaining the health and performance of any infrastructure or application. In this blog post, we explored how to get started with monitoring using Fluent Bit and Prometheus. We learned how to install and configure Fluent Bit, how to set up Prometheus as a monitoring solution, and how to use Grafana to visualize metrics data.
While the configuration for Fluent Bit is simple, it is prone to human error, especially when you have a large and complex infrastructure or application to monitor. In such a situation arises a need for a tool that can remove this element and make the whole process of setting up a pipeline faster.
Calyptia provides a solution that simplifies the configuration and management of observability pipelines. From inputs to filters and outputs, it can do everything with a neat UI, thus making it simpler to use and quickening the process. Check out Calyptia Core for free to learn more and discover how you can set up observability pipelines in minutes.
You might also like

Fluent Bit and Fluentd – a child or a successor?
Fluent Bit may have started as a sibling to Fluentd, but it is fair to say that it has now grown up and is Fluentd's equal. Learn which is right for your needs and how they can be used together.