How to send Logs to Loki using Fluent Bit
How to send Logs to Loki using Fluent Bit

Modern applications generate a massive volume of logs and other telemetry data, which requires an efficient log management solution. Loki, an open-source log aggregation system from Grafana, is a popular solution for companies. It allows for storing, searching, and analyzing huge volumes of data quickly and easily. Grafana has an open-source observability stack called LGTM, which stands for Logs, Metrics, Traces, and Monitoring. LGTM consists of various components, including Loki for logs, Prometheus for metrics, Jaeger for tracing, and Grafana for visualization. For the scope of this blog, we will look into Loki.
Fluent Bit is a leading open-source solution for collecting, processing, and routing large volumes of telemetry data. It is widely used as an agent for sending logs to Loki. In this blog, we will cover why using Fluent Bit to send logs to Loki is a better option than using the agent provided by Grafana with a demo example.
Why Use Fluent Bit for Sending Logs to Loki?
Lightweight and Fast
Fluent Bit is a lightweight and fast solution for sending logs to Loki. It requires fewer system resources and runs faster than other log collection agents. As a result, it can process a massive amount of log data with minimal impact on system performance. Its footprint is only ~ 450kb, but it certainly punches above its weight class when it comes to processing millions of records daily.
Vendor-Neutral Solution
The vendor neutrality of Fluent Bit provides a significant benefit in terms of flexibility and interoperability. Since it is not tied to any specific vendor or product, it can be easily integrated into any existing technology stack, making it a highly adaptable and versatile solution for log forwarding and processing. This allows organizations to avoid vendor lock-in and choose the best tools for their specific needs rather than being limited to a single vendor’s products.
It can send data to all of the major backends, such as Elasticsearch, Splunk, Datadog, and more. This helps you to avoid costly vendor lock-in. Transitioning to a new backend is a simple configuration change—no new vendor-specific agent to install across your entire infrastructure.
Supports Multiple Platforms
Fluent Bit supports multiple platforms, including Windows, Linux, macOS, and Kubernetes, making it an ideal solution for companies with diverse IT environments.
Open Source
Fluent Bit is open source. Fluent Bit is a graduated Cloud Native Computing Foundation project under the Fluentd umbrella.
Wide Range of Input and Output Plugins
Fluent Bit offers a wide range of input and output plugins allowing it to collect and send logs from various sources to various destinations. These plugins include file, syslog, TCP, HTTP, and more.
Easy to Configure
Fluent Bit is easy to configure and deploy, even for users with limited technical expertise. Its configuration files are written in a simple and easy-to-understand syntax, and it offers extensive documentation and community support.
Battle Tested and Trusted
Fluent Bit is trusted. Fluent Bit has been downloaded and deployed billions of times. In fact, it is included with major Kubernetes distributions, including Google Kubernetes Engine (GKE), AWS Elastic Kubernetes Service (EKS), and Azure Kubernetes Service (AKS).
Now that we know the benefits and why organizations prefer to use Fluent Bit, let’s go over some basic concepts before we get started on the demo.
How does Fluent Bit Work?
At a high level, Fluent Bit works by taking data from various sources (Inputs), parsing and transforming that data (Parsers), and then sending it to various destinations (Outputs).
Here’s a brief explanation of each component in Fluent Bit:
Inputs: These are data sources that Fluent Bit reads from. Examples include log files, Docker containers, system metrics, and many more. Fluent Bit supports a wide range of Inputs out of the box.
Parsers: Once Fluent Bit has read the data, it can be transformed using Parsers. These are responsible for recognizing the format of the incoming data, extracting the relevant fields, and mapping them to a structured format. Parsers help make the data more manageable and can even allow for real-time alerting.
Outputs: The last step in Fluent Bit’s data collection process is sending the transformed data to various destinations. Outputs include Elasticsearch, Kafka, Amazon S3, and many more. Fluent Bit allows for the routing and filtering of data before it is sent to the desired destination, making it a powerful tool for managing large amounts of data.
You can read more about Fluent Bit in detail here.
How does Loki benefit from the use of Fluent Bit?
Fluent Bit acts as a bridge between your logs and Loki, which is a horizontally-scalable, highly-available, and multi-tenant log aggregation system. Fluent Bit can parse and structure logs into the format Loki requires , making it easier to search and analyze log data. It can also compress and batch logs, reducing network bandwidth and improving performance.
By using Fluent Bit to send logs to Loki, you can take advantage of Loki’s advanced features, such as query language and alerts, to gain insights into your applications and infrastructure. Fluent Bit can also be configured to use the Loki API to create, update, and delete labels for your log streams, enabling the better organization and filtering of log data. Overall, Fluent Bit can help make log collection and analysis more efficient and effective, particularly in large-scale environments.
Let’s begin with a demo of how you can send logs to Loki, but first, go through the prerequisite.
Prerequisite
For this demo, you will need to have Docker and Docker Compose installed. If you don’t have it already installed, you can follow the install docker-compose official documentation, which has very well-articulated steps. Lastly, you need a Grafana Cloud Account; even a trial account would work for this demo; head over to sign up for a trial.
Once you’re done with the installation, let’s look at the configuration for Fluent bit. The below configuration is fairly simple and not meant for production use.
Configure Fluent Bit
Fluent Bit can be configured using a configuration file or environment variables. The configuration file is written in a simple syntax, and it allows for easy management of complex pipelines. Environment variables can also be used to configure Fluent Bit, and they provide a simple way to pass configuration data without needing a configuration file. Once the configuration is set up, Fluent Bit can be run as a standalone process or as a sidecar in containerized environments.
For this demo, we will be going ahead with a configuration file.
[SERVICE]
   flush 1
   log_level info
Since this file only contains information about the service (The SERVICE defines the global behavior of the Fluent Bit engine), will need to define input and outputs as well.
Input Configuration
Fluent Bit accepts data from a variety of sources using input plugins. The `tail` input plugin allows you to read from a text log file as though you were running the `tail -f` command
Add the following to your fluent-bit.conf file.
[SERVICE]
   flush 1
   log_level info

[INPUT]
   name     tail
   path     /etc/data/data.log
   tag      log_generator
The path parameter in Fluent Bit’s configuration may need to be adjusted based on the source of your logs. The plugin name, which identifies which plugin Fluent Bit should load, cannot be customized by the user. The tag parameter is optional but can be used for routing and filtering your data, as discussed in more detail below.
Output Configuration
As with inputs, Fluent Bit uses output plugins to send the gathered data to their desired destinations.
To set up your configuration, you will need to gather some information from your Grafana account: See the image below for how to locate it from Grafana cloud page.
HOST_NAME – Cloud Loki instance URL.
USER_NAME – User name of Cloud Loki Instance
API_KEY – API Key of Cloud Loki Instance
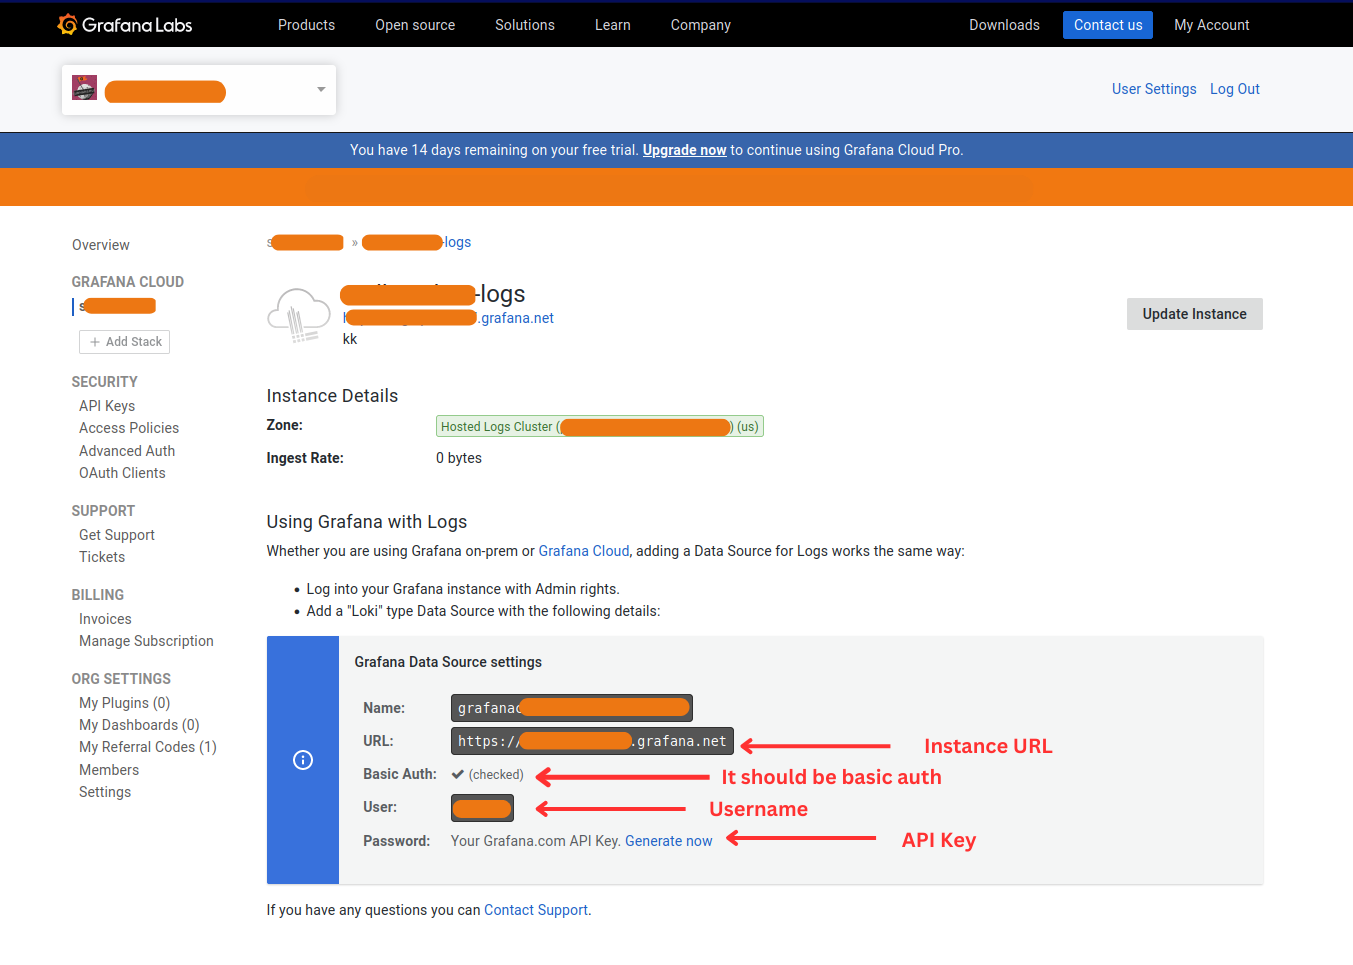
Once you have gathered the required information, add the following to your fluent-bit.conf file below the Input section.
[SERVICE]
   flush       1
   log_level   info
[INPUT]
   name        tail
   path        /etc/data/data.log
   tag         log_generator
[OUTPUT]
   Name        stdout
   Match       *
[OUTPUT]
      # for sending logs to local Loki instance
   name        loki
   match       *
   host        loki
   port        3100
   labels      job=fluentbit
[OUTPUT]
       # for sending logs to cloud Loki instance
   Name        loki
   Match       *
   Host        HOST_NAME
   port        443
   tls         on
   tls.verify  on
   http_user   USER_NAME
   line_format json
   labels      job=fluentbit
   http_passwd API_KEY
Tip
If you want to look into more details of each output parameters of Loki plugin you check out here.
The Match * parameter indicates that all of the data gathered by Fluent Bit will be forwarded to Loki instance. We could also match based upon a tag defined in the input plugin. tls On ensures that the connection between Fluent Bit and the Loki instance is secure. By default, the Port is configured to 9200, so we need to change that to 9243, which is the port used by Loki Cloud
Note: We have also defined a secondary output that sends all the data to stdout. This is not required for the Loki configuration but can be incredibly helpful if we need to debug our configuration.
Start Sending Your Logs!
For ease of setup, I’ve written a docker-compose file as follows, and it will help you get started with all the necessary things, such as Grafana, Loki, Log generator, and Fluent Bit instance running on local.
version: "3"

networks:
  loki:

volumes:
  log-data:
  driver: local
services:
  flog-log:
  image: mingrammer/flog
  command: "-f json -t log -l -w -d 5s -o /etc/data/data.log"
  volumes:
    - log-data:/etc/data
  fluent-bit:
  image: fluent/fluent-bit
  volumes:
    - ./fluent-bit.conf:/fluent-bit/etc/fluent-bit.conf
    - log-data:/etc/data
  depends_on:
    - loki
  networks:
      - loki

  loki:
  image: grafana/loki:2.7.0
  ports:
    - "3100:3100"
  command: -config.file=/etc/loki/local-config.yaml
  networks:
    - loki

  grafana:
  image: grafana/grafana:latest
  ports:
    - "3000:3000"
  networks:
    - loki
  environment:
    - GF_PATHS_PROVISIONING=/etc/grafana/provisioning
    - GF_AUTH_ANONYMOUS_ENABLED=true
    - GF_AUTH_ANONYMOUS_ORG_ROLE=Admin
  entrypoint:
      - sh
      - -euc
      - |
        mkdir -p /etc/grafana/provisioning/datasources
        cat < /etc/grafana/provisioning/datasources/ds.yaml
        apiVersion: 1
        datasources:
        - name: Loki
          type: loki
          access: proxy
          orgId: 1
          url: http://loki:3100
          basicAuth: false
          isDefault: true
          version: 1
          editable: true
        EOF
        /run.sh
Put the fluent-bit.conf and docker-compose.yaml file in the same directory, and run the command below to get things up and running; make sure you’re running the terminal within the same directory.
➜  demo-fluent-bit docker-compose up
[+] Running 4/0
 ⠿ Container demo-fluent-bit-flog-log-1	Created                                                                            	0.0s
 ⠿ Container demo-fluent-bit-loki-1    	Created                                                                            	0.0s
 ⠿ Container demo-fluent-bit-grafana-1 	Created                                                                            	0.0s
 ⠿ Container demo-fluent-bit-fluent-bit-1  Created                                                                            	0.0s
Attaching to demo-fluent-bit-flog-log-1, demo-fluent-bit-fluent-bit-1, demo-fluent-bit-grafana-1, demo-fluent-bit-loki-1
demo-fluent-bit-loki-1    	| level=info ts=2023-02-20T09:45:30.981870161Z caller=main.go:103 msg="Starting Loki" version="(version=2.7.0, branch=HEAD, revision=1b627d880)"
demo-fluent-bit-loki-1    	| level=info ts=2023-02-20T09:45:30.982532796Z caller=server.go:323 http=[::]:3100 grpc=[::]:9095 msg="server listening on addresses"
demo-fluent-bit-loki-1    	| level=warn ts=2023-02-20T09:45:30.986650564Z caller=cache.go:114 msg="fifocache config is deprecated. use embedded-cache instead"
demo-fluent-bit-loki-1    	| level=warn ts=2023-02-20T09:45:30.986689968Z caller=experimental.go:20 msg="experimental feature in use" feature="In-memory (FIFO) cache - chunksembedded-cache"
demo-fluent-bit-loki-1    	| level=info ts=2023-02-20T09:45:30.987051548Z caller=table_manager.go:404 msg="loading local table index_19408"
Verify the pipeline
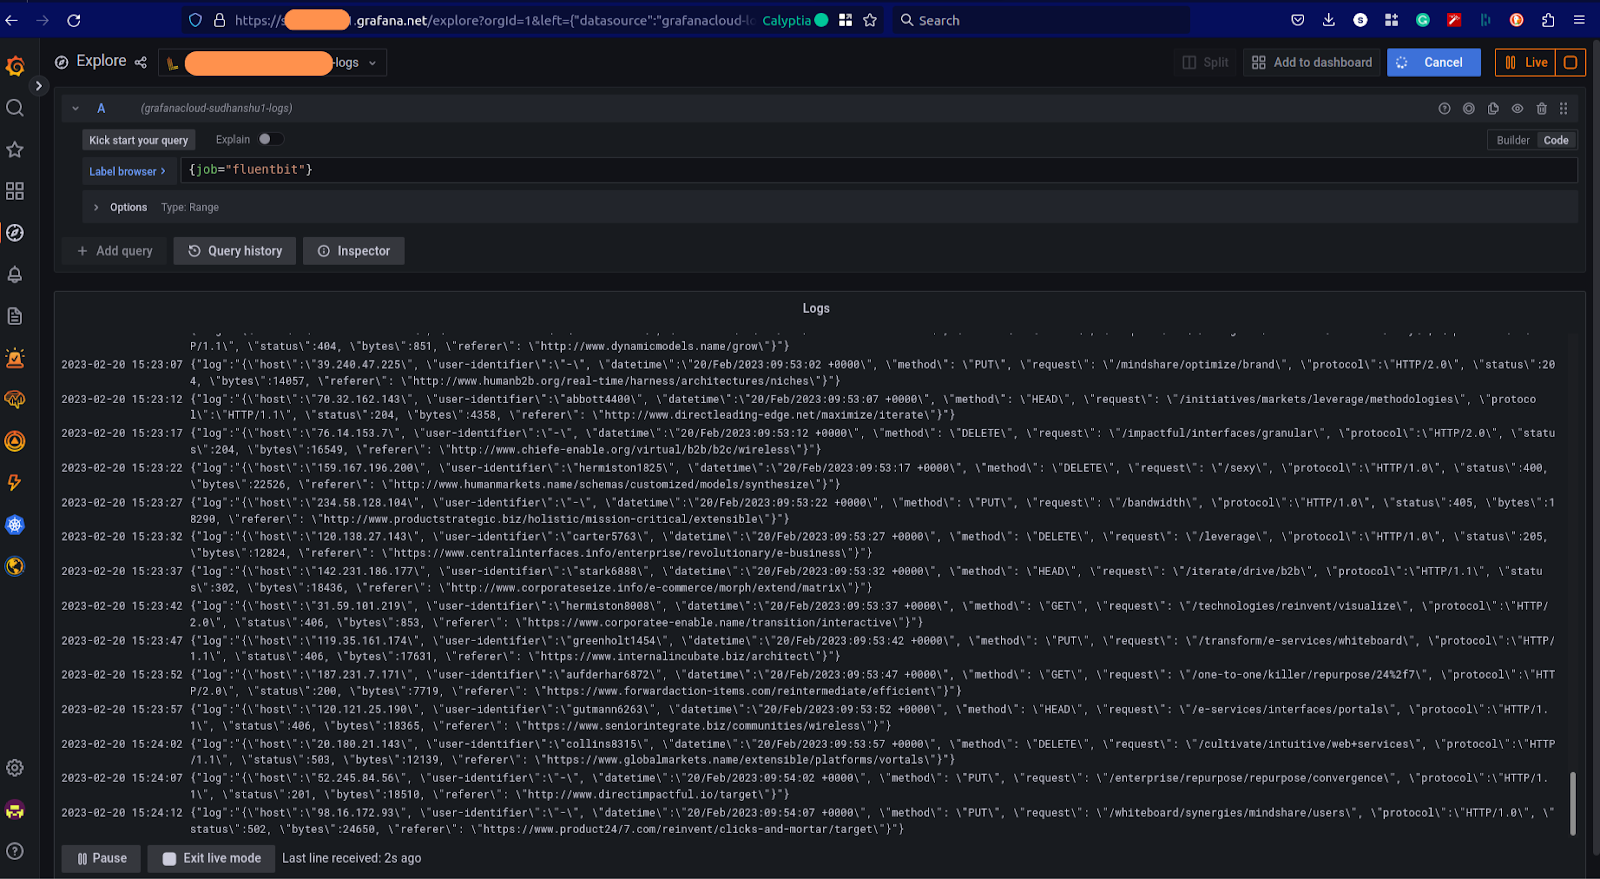
Once, all the services are up, as defined in docker-compose, you can head over to localhost:3000/ this where we port-forwarded our Grafana instance with Loki as a data source.
Check out the below screenshot where Logs are coming to cloud Loki.
At the same time, it is coming to our local instance of Loki; since we’ve already added Loki as a datasource, we can explore that in Grafana now.
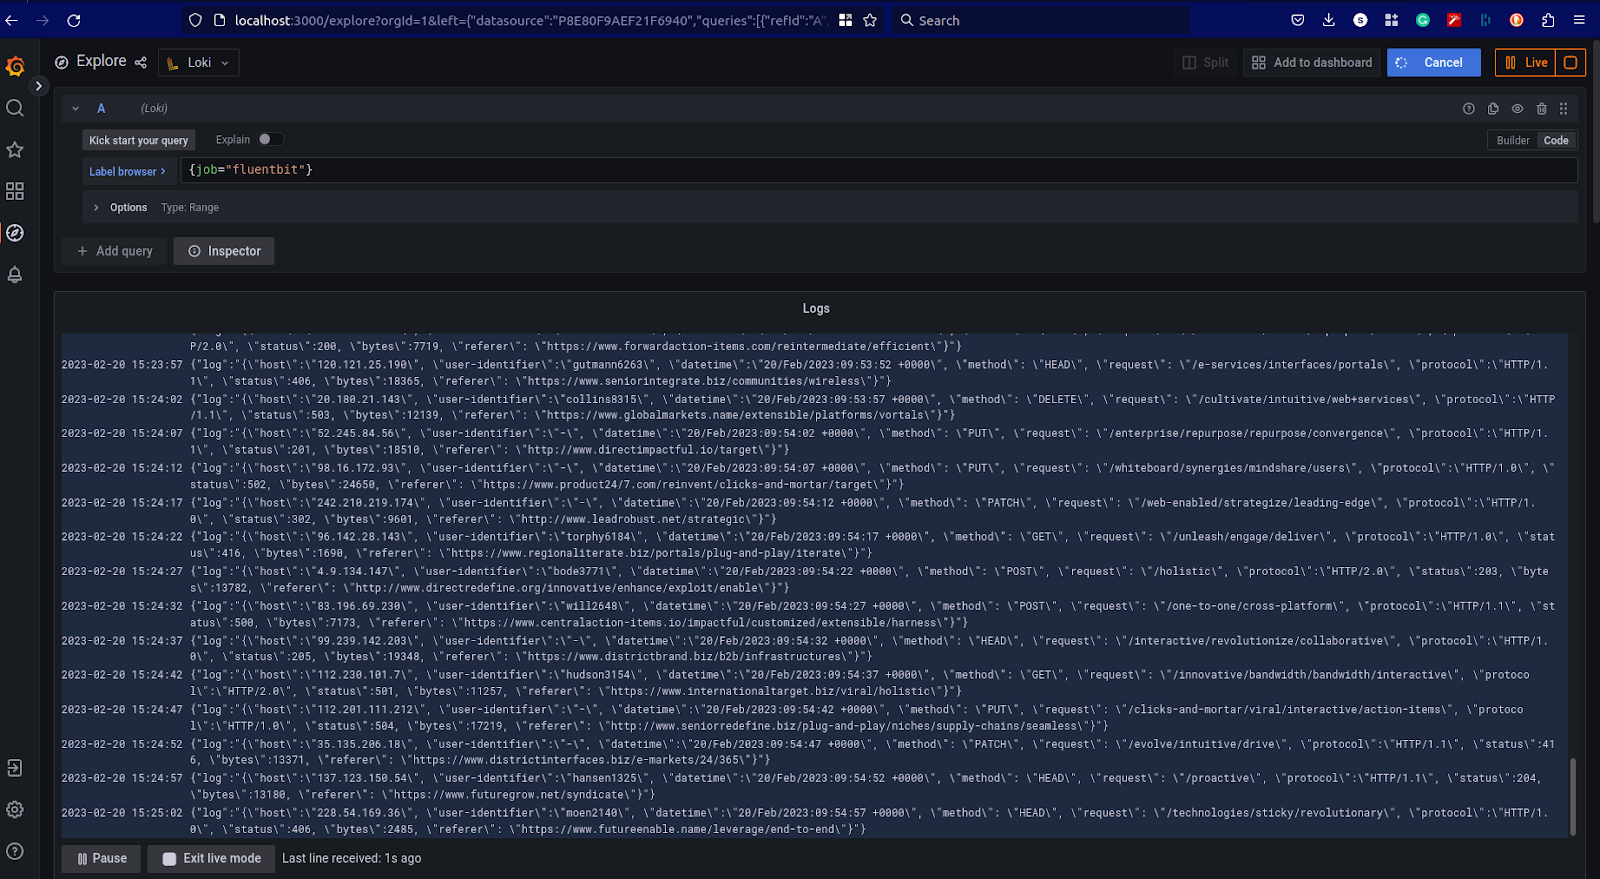
That’s it, and you have successfully built your own logs pipeline. Now, let’s take a look at what more you can do with Fluent Bit.
More with Fluent Bit
We’ve just seen a basic configuration for getting log data from Fluent Bit into Loki in Grafana Cloud. The Fluent Bit Loki output plugin supports many additional parameters that enable you to fine-tune your Fluent Bit to the Grafana Loki pipeline; check out the Fluent Bit documentation for more.
Fluent Bit also allows you to process the data before sending it to its final destination. You can, for example:
Add additional data that would generally be lost downstream.
Route data to different backends depending upon its content or tag
Routing is particularly powerful as it allows you to redirect non-essential data to cheaper storage (or even drop it entirely), potentially saving you thousands of dollars when using costly storage and analysis applications priced by consumption.
Streamline Your Fluent Bit Data Pipelines with Calyptia Core
As we have seen, Fluent Bit is a powerful component of your telemetry pipeline and is relatively simple to configure manually. However, such manual configuration becomes untenable as your infrastructure scales to dozens, hundreds, or even thousands of sources. If you want to learn more about how you can segment logs per destination, we have a blog where you can read more about it.
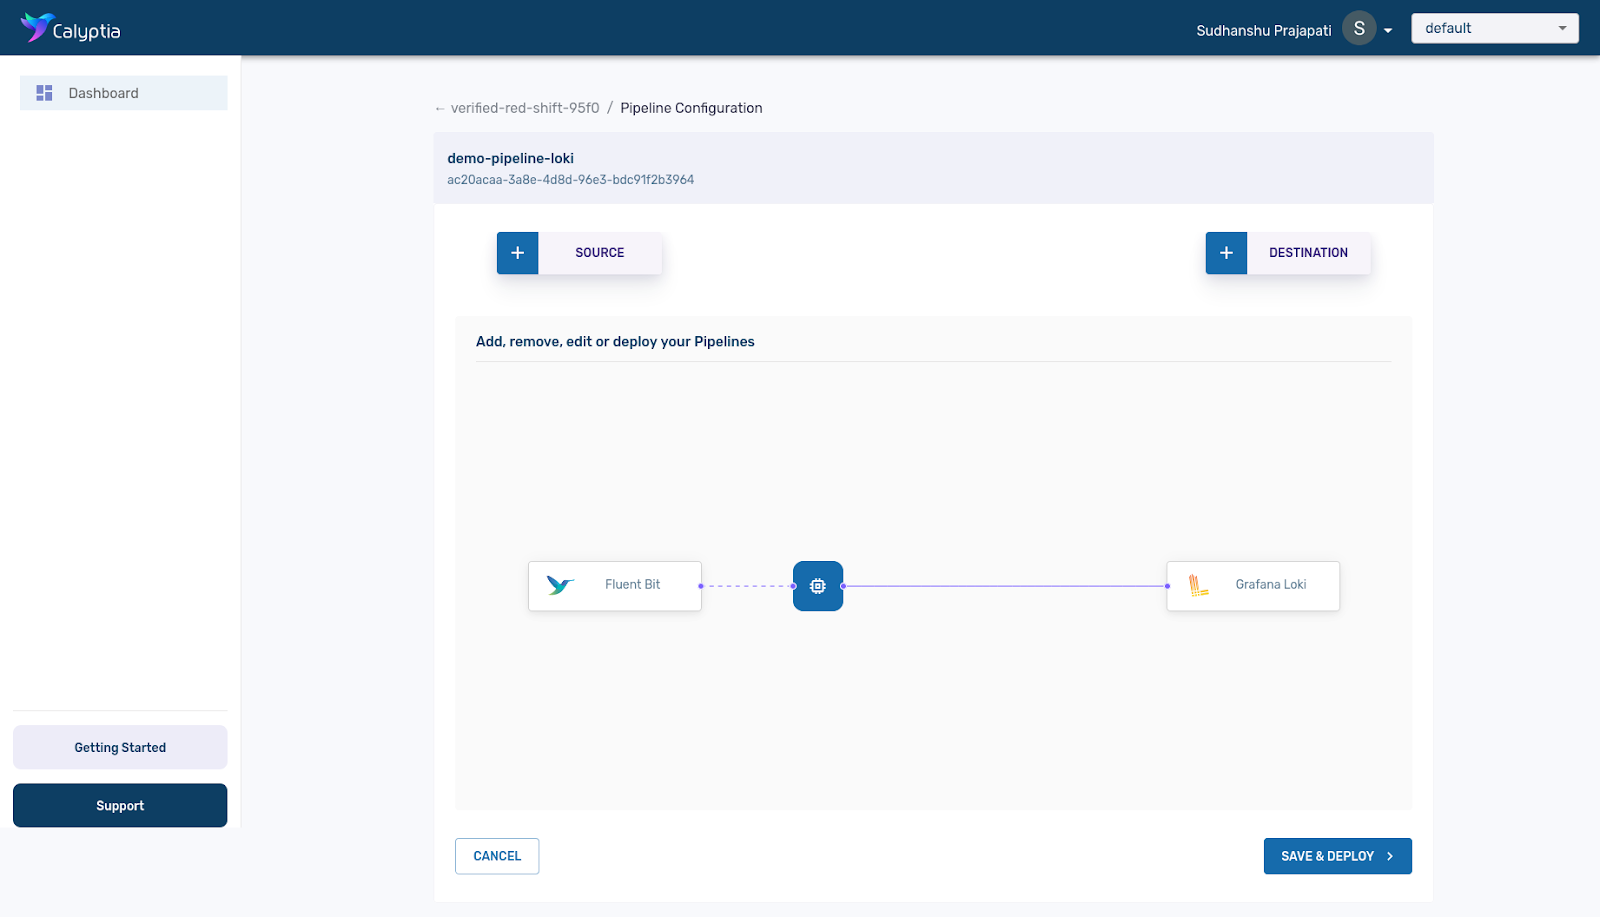
Calyptia Core allows organizations to manage their telemetry pipelines with click-and-drag simplicity at scale. Powered by Fluent Bit, it provides all of the benefits of the open source solution and offers a clean and intuitive interface for managing and configuring your telemetry pipeline — no more manual editing of config files — which can dramatically reduce the time and resources spent on management and increase the efficiency of your Dev teams.
Schedule a demo to see how Calyptia Core can help you reduce costs and increase productivity.
You might also like
Fluent Bit and Fluentd – a child or a successor?
Fluent Bit may have started as a sibling to Fluentd, but it is fair to say that it has now grown up and is Fluentd's equal. Learn which is right for your needs and how they can be used together.