
Using eBPF with Fluent Bit and Tracee: How to forward eBPF output to any destination
Using eBPF with Fluent Bit and Tracee: How to forward eBPF output to any destination
Introduction
If you saw our recent highlights of KubeCon post, you will know eBPF is gaining a lot of traction, particularly for observability in the security domain but also across all others. This post covers a simple example of how to combine eBPF monitoring with Aquasec’s Tracee tool with the ability to send to any destination (Grafana, Elastic, Datadog, Splunk, etc.) using Fluent Bit.
Everything from this example can be found in the Github Repository here: https://github.com/calyptia/blog-posts/tree/main/fluent-bit-tracee-integration
What is eBPF?
Our (!) short answer is that eBPF is a mechanism to run simple programs in kernel space triggered by a myriad of (sometimes very low level) events. It’s an efficient way to trigger some processing: be that enforcement of certain restrictions, adaption of data (e.g., instead of iptables), or sending a notification to someone.
The longer answer is to have a look at the various talks, articles, and documentation on it all! A good first step is here.
In this case, we’re using eBPF to trigger notifications when various events happen, which is particularly useful in a security context for auditing what is going on. We can transfer this information to any Fluent Bit supported output.
Why Tracee?
Tracee uses Linux eBPF technology to trace system interaction and applications at runtime and then analyses the collected events to detect suspicious behavioural patterns. It does not enforce behaviour but instead monitors it for others to enforce, review or act on in any way they want to.
As the Aquasec team explains:
We wrote Tracee with the following in mind:
Tracee was designed to be a lightweight event tracer based on eBPF from its inceptionTracee is built on bcc, and doesn’t rewrite the low level BPF interface.Tracee was designed to be easily extensible, for example, adding support for new system calls in tracee is as easy as adding two lines of code, where you describe the syscall name and argument types.Other events are also supported, such as internal kernel functions. We now already have cap_capable supported, and we are adding support for security_bprm_check lsm hook. As lsm security hooks are strategic points to security, we plan to add more of these in the near future.
Why Fluent Bit?
TLDR; industry standard, CNCF vendor-agnostic tool, and “just works.”
The observability space is large and complex with multiple vendors and solutions to observe the output, e.g., Grafana, Datadog, Elastic, New Relic, and much more.
Developing a bespoke log forwarding engine is a non-trivial task, particularly if you want to target various vendors or multiple endpoints. Therefore we can leverage Fluent Bit’s very mature and effective support for all this. You may also have Fluent Bit already deployed to handle your existing logs and metrics, plus soon traces.
There is another post on configuring Fluent Bit to send to other destinations (even multiple at the same time) here. This example just covers a very simple local stack with everything running locally. The goal here is to focus on that “first mile” observability of getting the eBPF information into Fluent Bit to then send to any of the various integrations we support.
We follow the Unix mantra of using a dedicated tool for a specific purpose here instead of combining an eBPF monitoring engine with a vendor-agnostic log forwarding engine all into one super-complex and easy-to-break binary.
There are alternatives, of course. For example, Sysdig Falco and Cilium Tetragon are more complex eBPF options offering additional enforcement options using their custom syntax.
The first order of business is monitoring, though, and this is a very effective, low-cost way of doing that for any standard industry tool you choose. Once you can monitor, you can decide to enforce, audit, or do anything else you choose.
How can we integrate them?
Tracee currently only outputs to standard output but does provide a JSON format which is useful to simplify parsing.
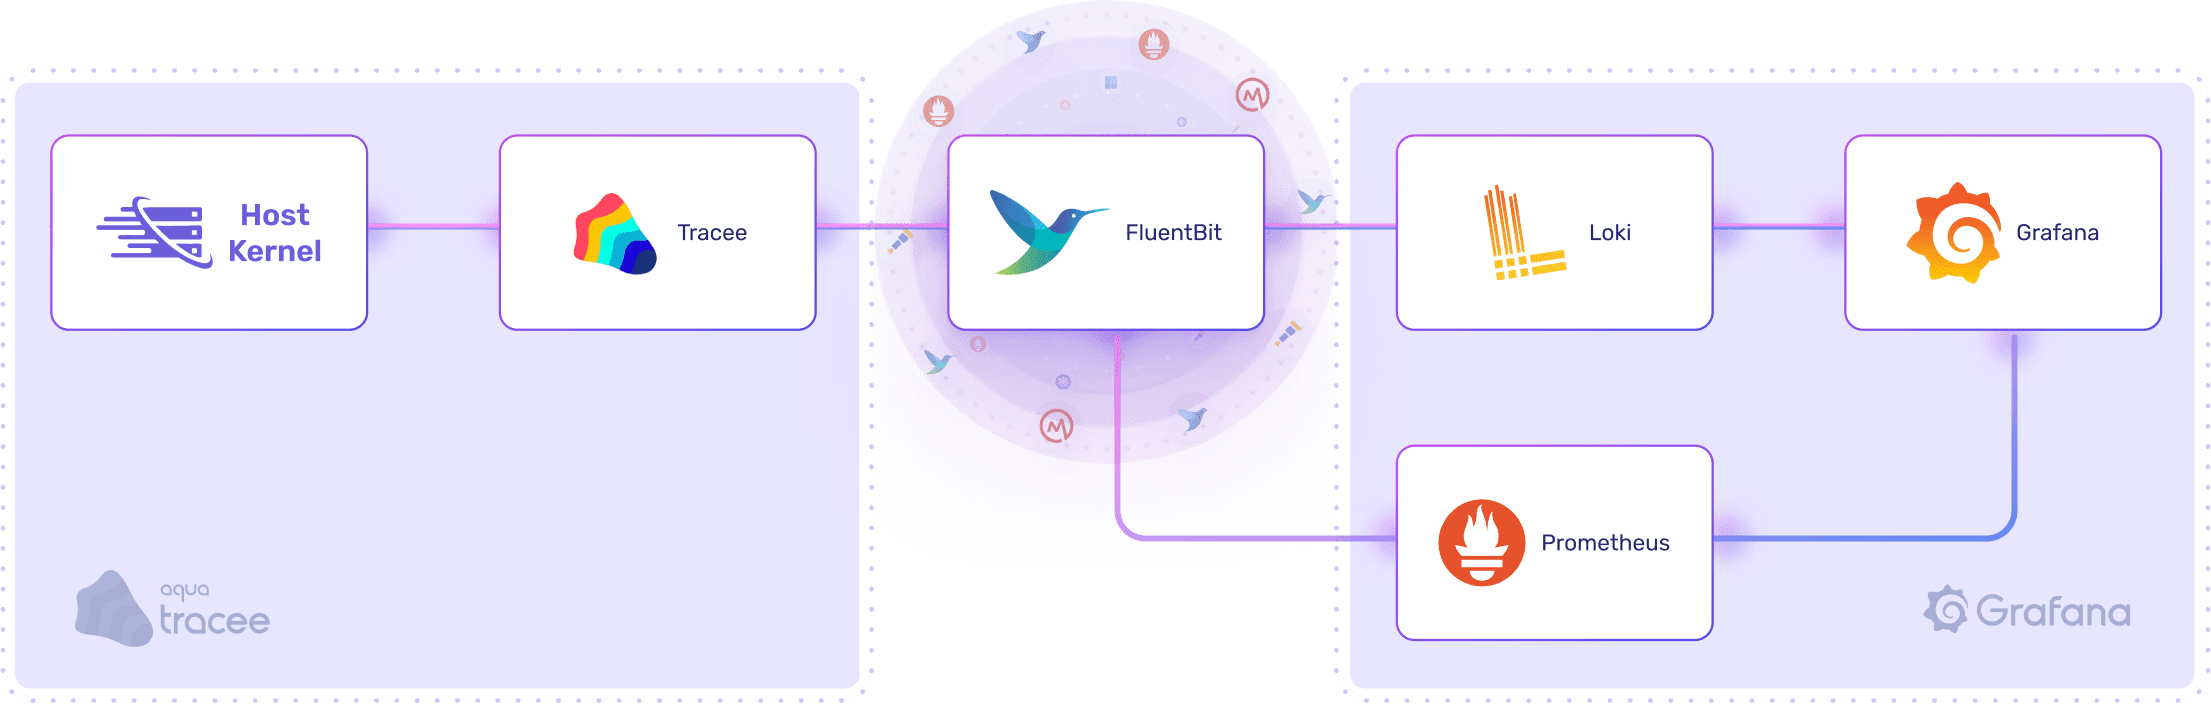
We take the Tracee output and forward it to a log file that the Fluent Bit service can then read from. We also spin up a simple Prometheus, Loki, and Grafana (PLG) stack to send the logs and metrics to.
For the purposes of this example, we run everything locally as a simple Docker Compose stack to make it easy to demonstrate the individual components.
The example is targeted at a Ubuntu 20.04 environment but should work on most targets – refer to the supported environments for Fluent Bit plus the information on how to use Tracee on other targets (the Tracee support is the main blocker usually as it needs more privileges).
$ git clone https://github.com/calyptia/blog-posts.git
$ cd fluent-bit-tracee-integration
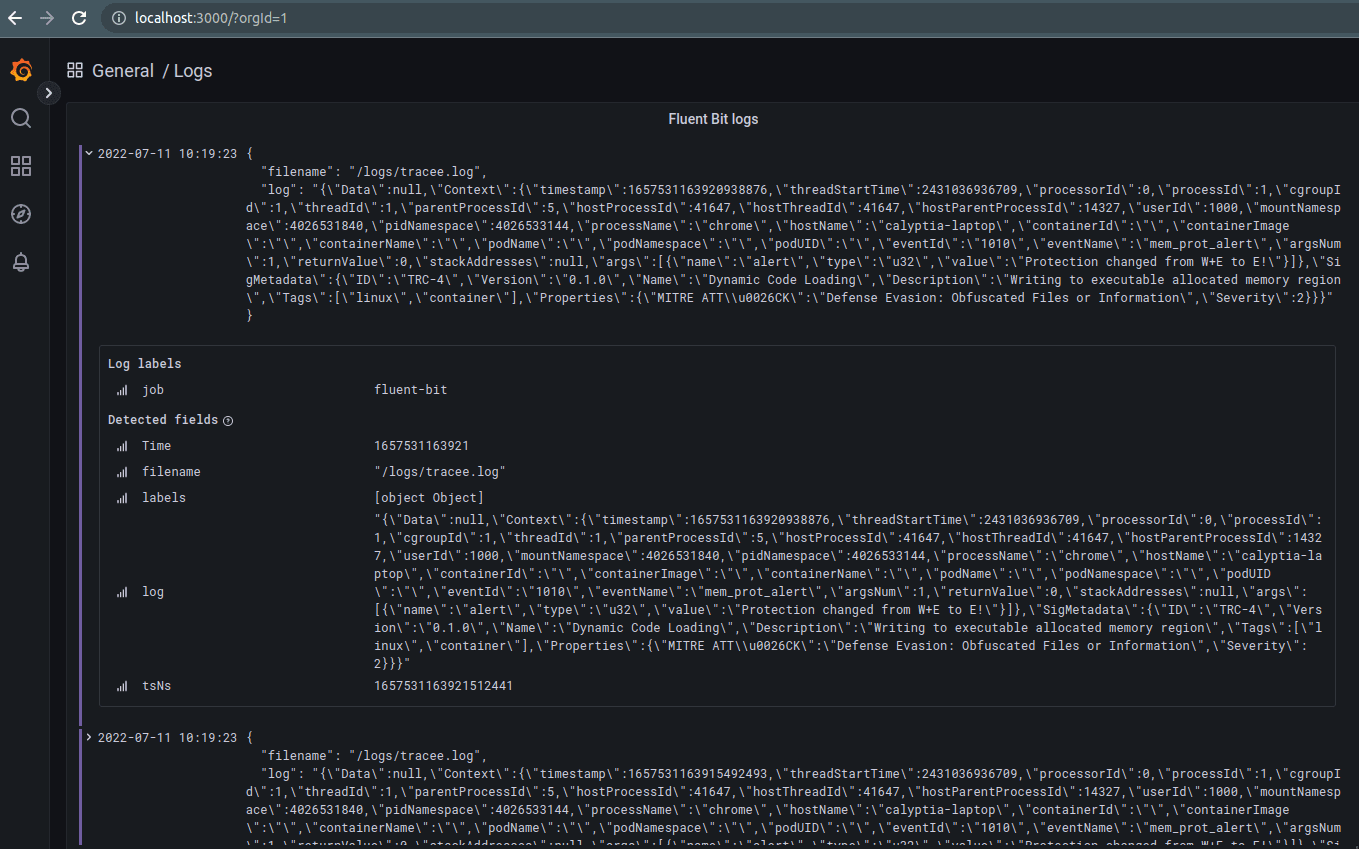
$ docker-compose up --force-recreate --always-recreate-deps --abort-on-container-exit --remove-orphansOnce this is all running, it will automatically provision everything in Grafana for you to then show a simple dashboard of the log output on http://localhost:3000. Default credentials are set for username admin and password as admin too.
The Tracee documentation has examples on how to trigger test reports as well, so you can view these in Grafana (or your visualisation tool of choice).
Be aware it may take a few minutes to pull all the containers and provide logs into the PLG stack before anything is displayed.
Follow on work
This is just a basic example of how you can easily integrate two very powerful tools to provide an effective monitoring solution out of the box for “free”. The individual services can be refactored as necessary to support your use case.
On-premise integration
The Docker Compose services for Tracee and Fluent Bit could be provided as systemd services in a production environment with Tracee writing to a standard log file/journal output and Fluent Bit picking them up automatically (which it may do already). This would likely be the best way to provide that, particularly if logrotate is also configured for the /var/log/tracee.log file as per best practice — currently the example stack may fill up the log volume (as well as the Loki or Prometheus volumes) as no protection is provided here.
Sending eBPF monitoring to another destination
Our previous blog post on using Fluent Bit to send to different vendors’ endpoints (at the same time if required) can be followed or the official documentation to provide the configuration to send to Grafana Cloud, Elastic Cloud, Datadog, etc.
You might also like

Fluent Bit and Fluentd – a child or a successor?
Fluent Bit may have started as a sibling to Fluentd, but it is fair to say that it has now grown up and is Fluentd's equal. Learn which is right for your needs and how they can be used together.