Send data to Splunk, Elasticsearch, and Grafana Loki
Send data to Splunk, Elasticsearch, and Grafana Loki
Note: the functionality of the Config Visualizer application mentioned below has been incorporated into Calyptia Core, which is free to try. Config Visualizer is no longer available as a stand alone product.
Observability platforms continue to evolve every few years offering greater abilities for developers to debug and troubleshoot their code. Three popular observability platforms include Splunk, Elasticsearch, and Grafana’s Loki. Each platform offers its own experience on how to send data to its respective platform, however, maintaining separate agents per platform can offer you less flexibility and higher maintenance costs. In this blog, we will walk through using Calyptia Fluent Bit to send data to all three platforms in less than 5 minutes.
Benefits of using Calyptia Fluent Bit:
No vendor lock-in
Flexible routing (Keep data you want, throw away what you don’t)
Lightweight portable package based on open source
What is Calyptia Fluent Bit
Fluent Bit is an open-source project part of the Cloud Native Computing Foundation and part of the broader Fluent Ecosystem. Calyptia Fluent Bit is a long-term supported version of Fluent Bit built from the creators and maintainers for enterprises – built to be extremely lightweight (<4MB RAM and 0.1 % CPU) while giving users high performance.
Send all data to all platforms
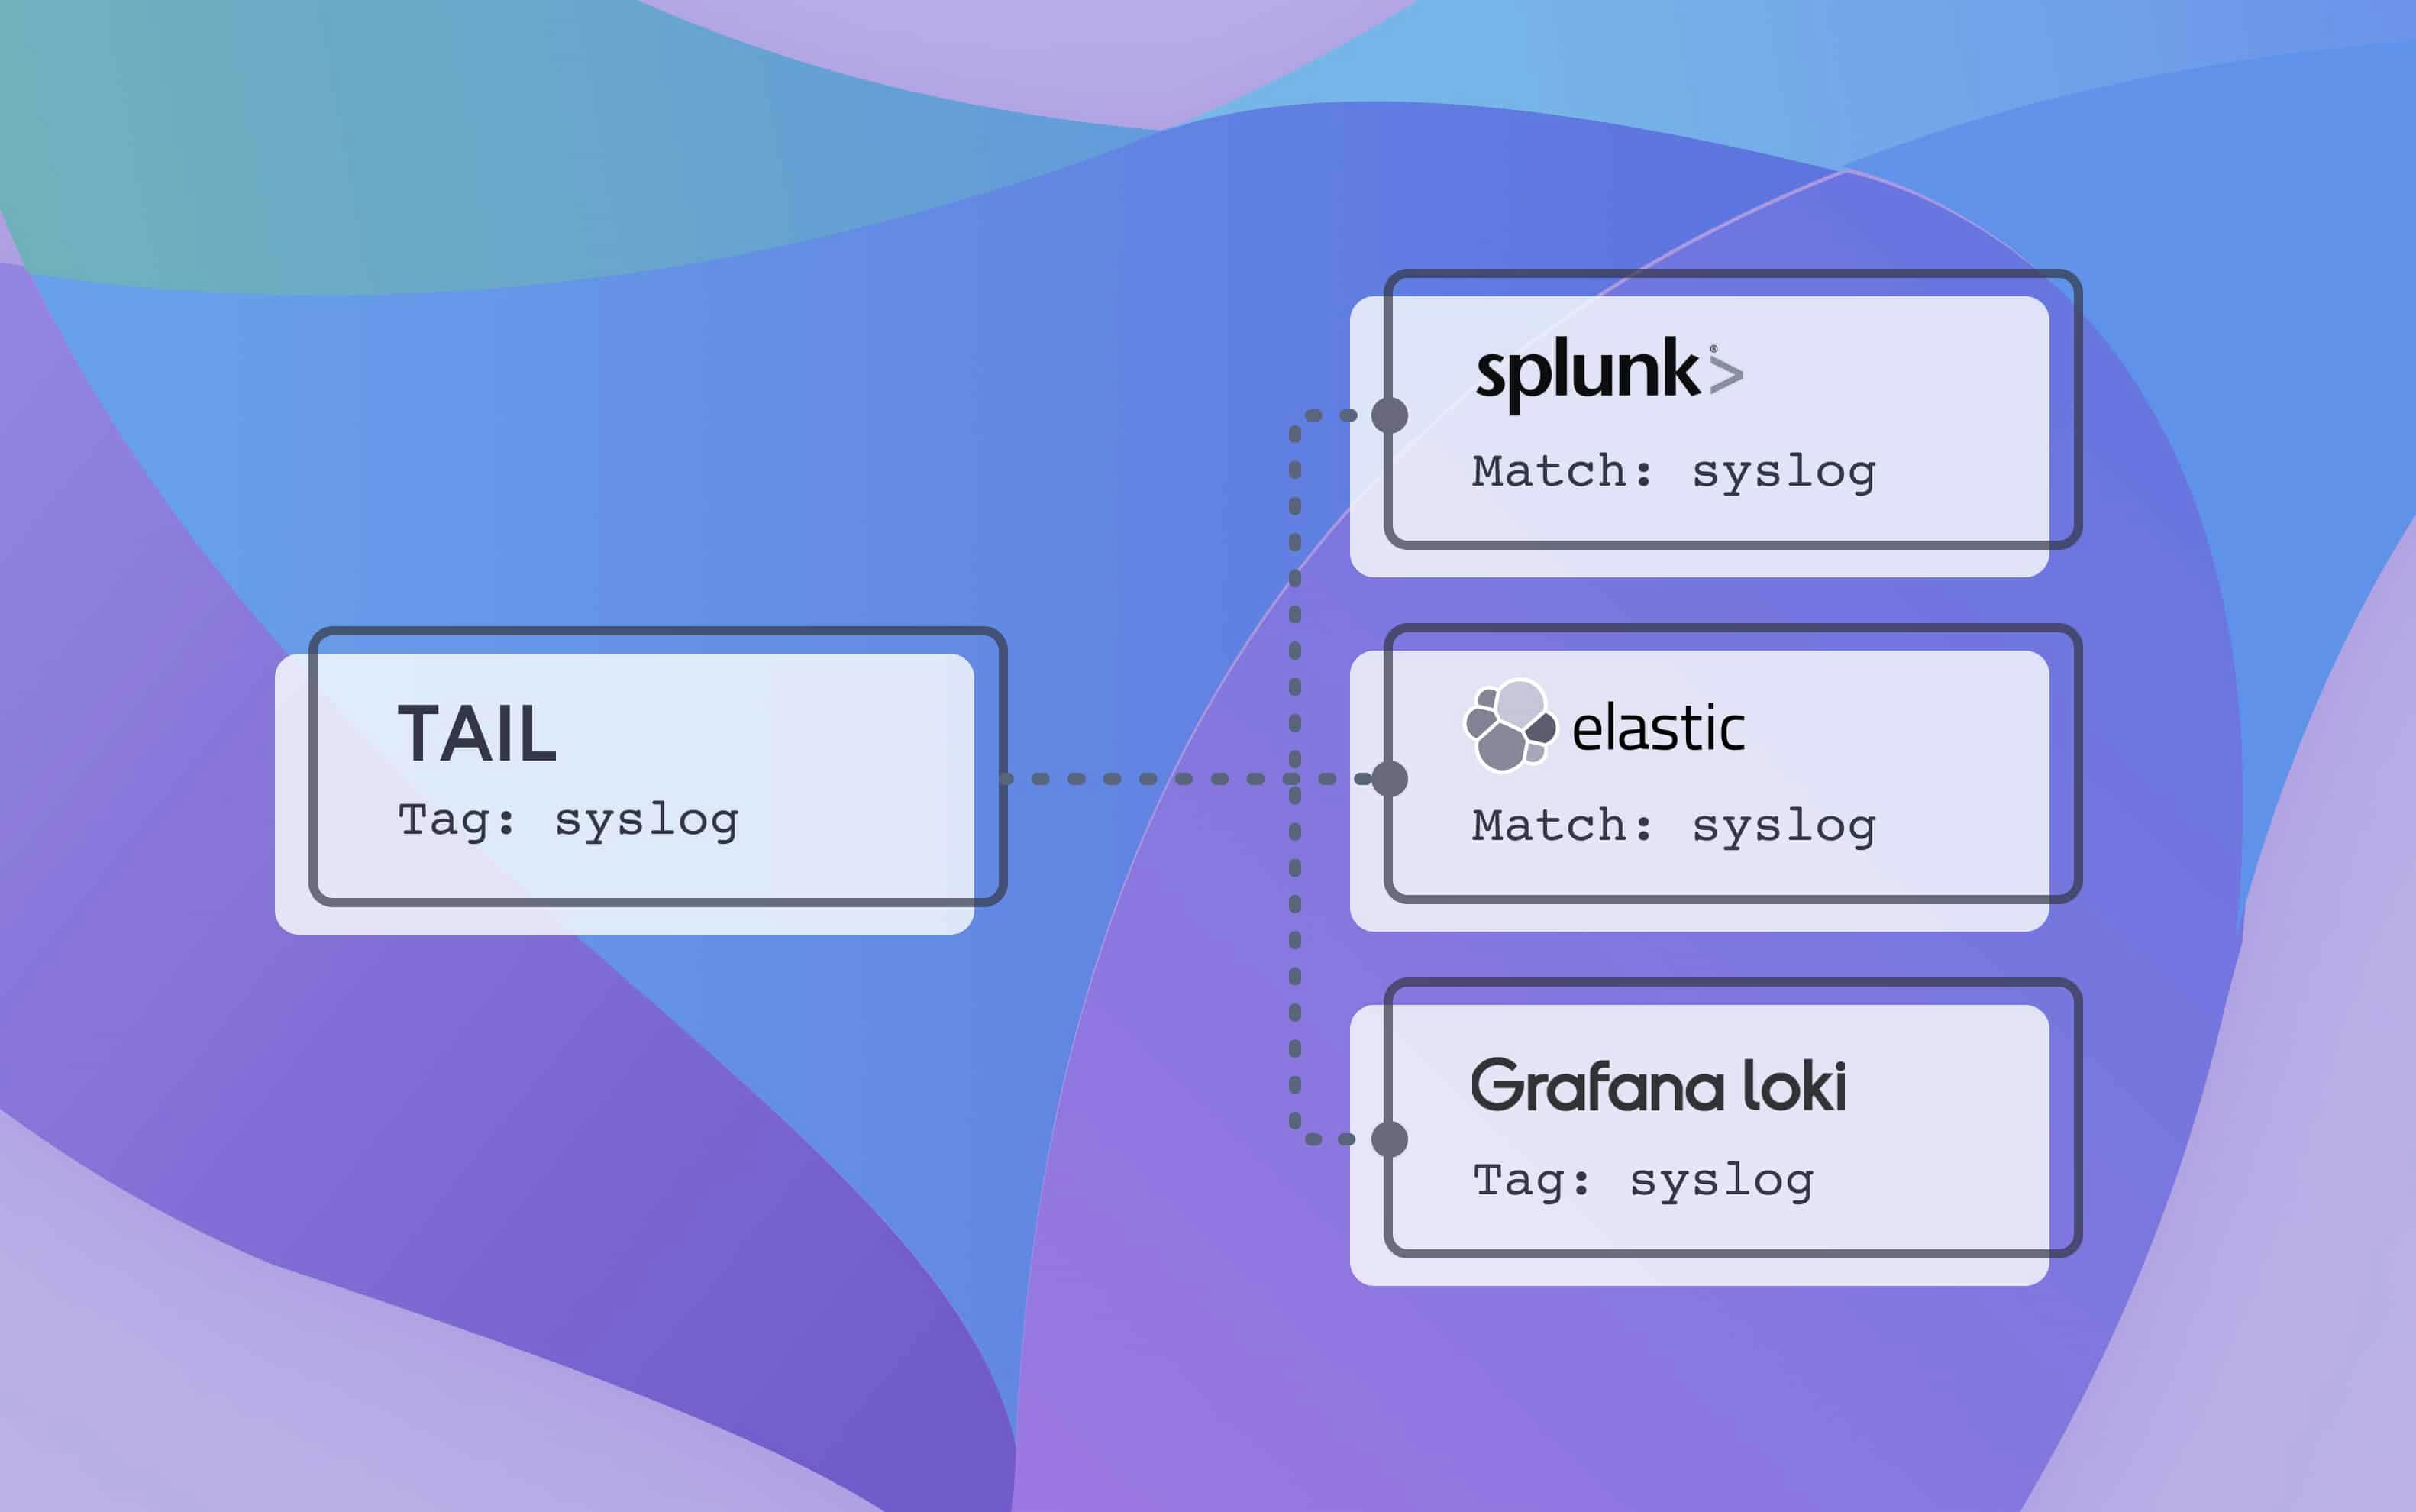
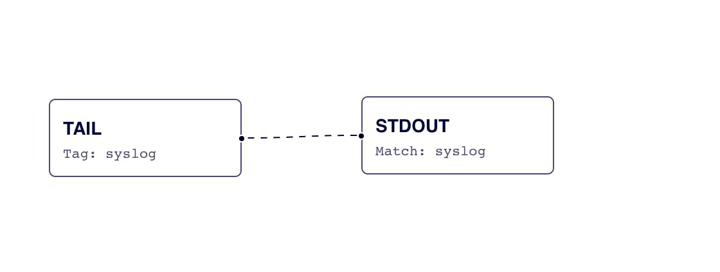
Let’s start with a simple configuration to send data to all platforms. Calyptia Fluent Bit’s configuration system works similarly to a pub/sub system. All incoming data is given a “tag” which then is routed to outputs that match that “tag”. An example of the architecture pipeline where we read in data from syslog and output to standard out is seen below:
For our pipeline, we will first tail a system file (/var/log/syslog); apply some parsing; and then route to each end destination. A sample configuration without TLS applied for Elasticsearch and Loki is seen below. Additionally, we can visualize this configuration with Calyptia’s Config Visualizer, which is free to sign up for (Note: the functionality of the Config Visualizer application has been incorporated into Calyptia Core, which is free to try. Config Visualizer is no longer available as a stand alone product.)
[INPUT]
    Name        tail
    Path        /var/log/syslog
    Parser    syslog
    Tag         syslog
[OUTPUT]
    Name  es
    Match syslog
    Host  192.168.2.3
    Port  9200
    Index my_index
    Type  my_type
[OUTPUT]
    name                   loki
    match                  syslog
    host                   127.0.0.1
    port                   3100
    labels                 job=fluentbit
    label_keys             $sub['stream']
    auto_kubernetes_labels on
[OUTPUT]
    name splunk
    match syslog
    host 127.0.0.1
    port 8088
    splunk_send_raw on
    splunk_token f9bd5bdb-c0b2-4a83-bcff-9625e5e908db
    tls on
    tls.verify off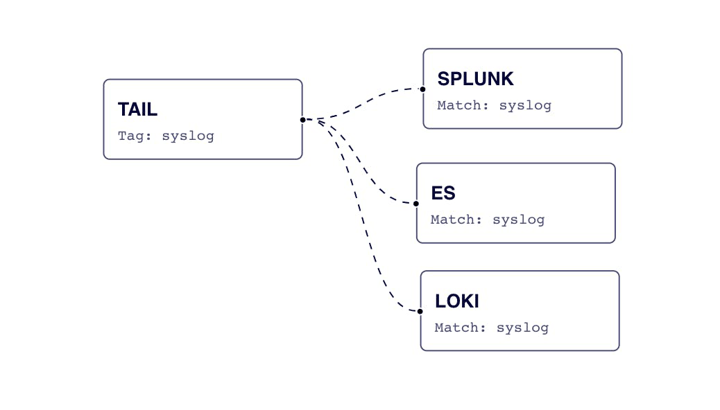
Segment data based on content
Let’s dive a bit deeper into another use case. Instead of sending all data to all platforms, we will segment the data based on the content. We will send security data to Splunk, we will send developer logs to Elasticsearch, and we will send a copy / archive of everything to Loki.
To perform this segmentation we will use the rewrite tag filter which allows us to search content within the message and route based off a match or not match.
In the following example, if the content contains “security” it will retag to Splunk if it contains “debug” or “INFO” then we retag to elasticsearch – we will also switch the match statements in both of those output plugins as well. Additionally, by setting the keep parameter in each rule to true we will make sure messages remain with their initial tag of “syslog” and get routed to Loki for archiving.
[FILTER]
    Name          rewrite_tag
    Match         *
    Rule            $message ^(security)$  splunk true
    Rule            $message ^(.*debug.*|.*INFO.*)$  elasticsearch true
    Emitter_Name  re_emitted
What’s next?
In this blog, we learned how to easily start sending data to 3 outputs with a single forwarder and in as little is 5 minutes. Next we can also route data to an additional 3 outputs of each cloud offering (Elastic Cloud, Grafana Cloud, Splunk Cloud) with the same forwarder and get a comparison of how the data performs for each. If you have any questions or want to get in touch feel free to reach out to us.
You might also like

A practical guide for avoiding data loss and backpressure problems with Fluent Bit
Learn how to detect and avoid backpressure problems with Fluent Bit by balancing memory-based and filesystem-based buffering.